Food and Nutrition situation of Nepal:
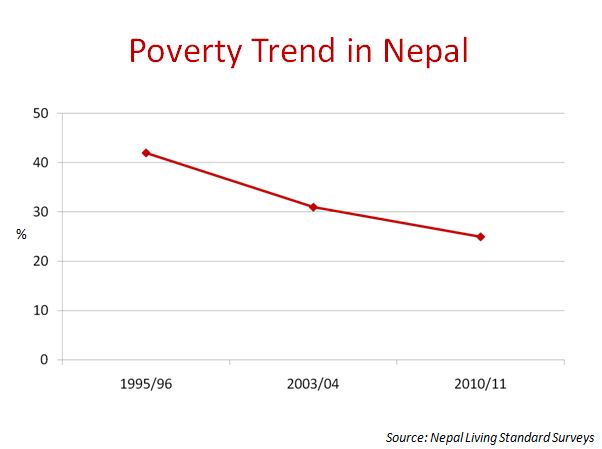
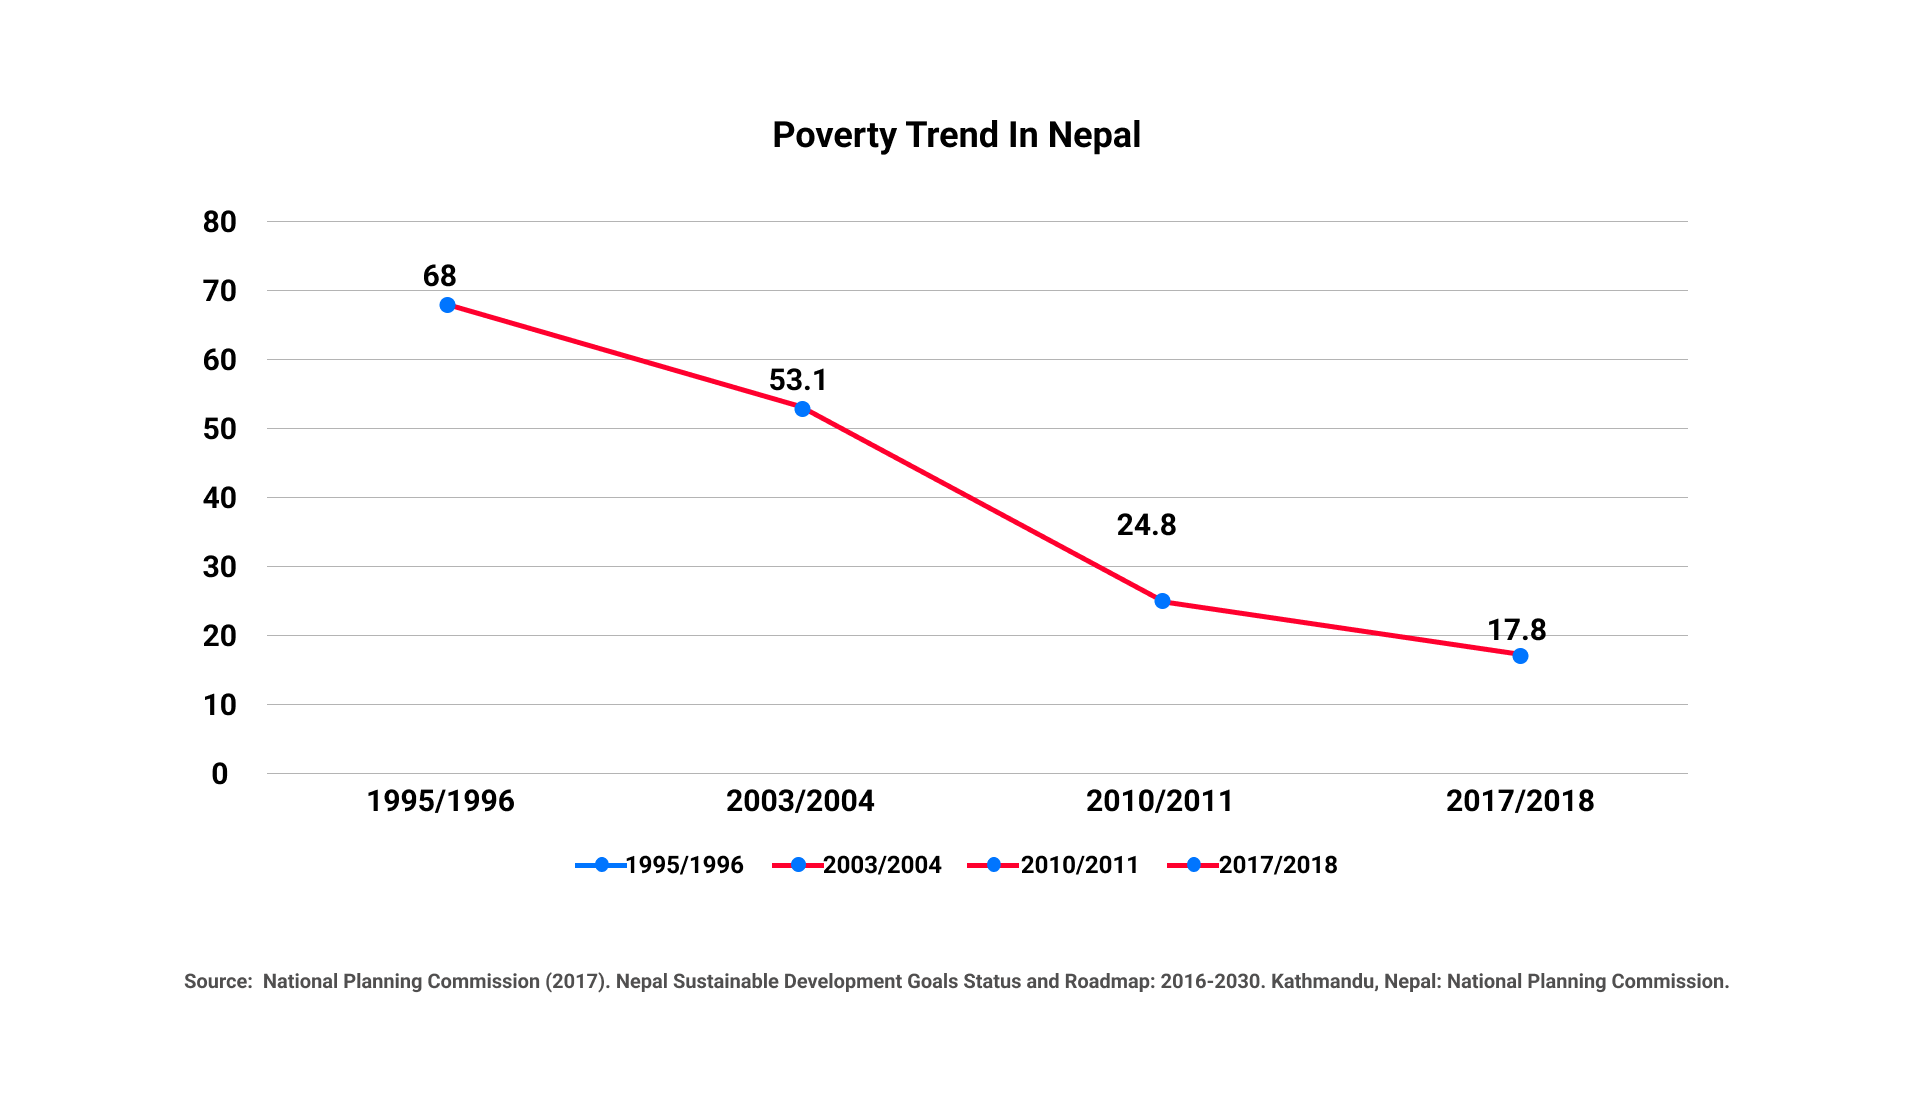
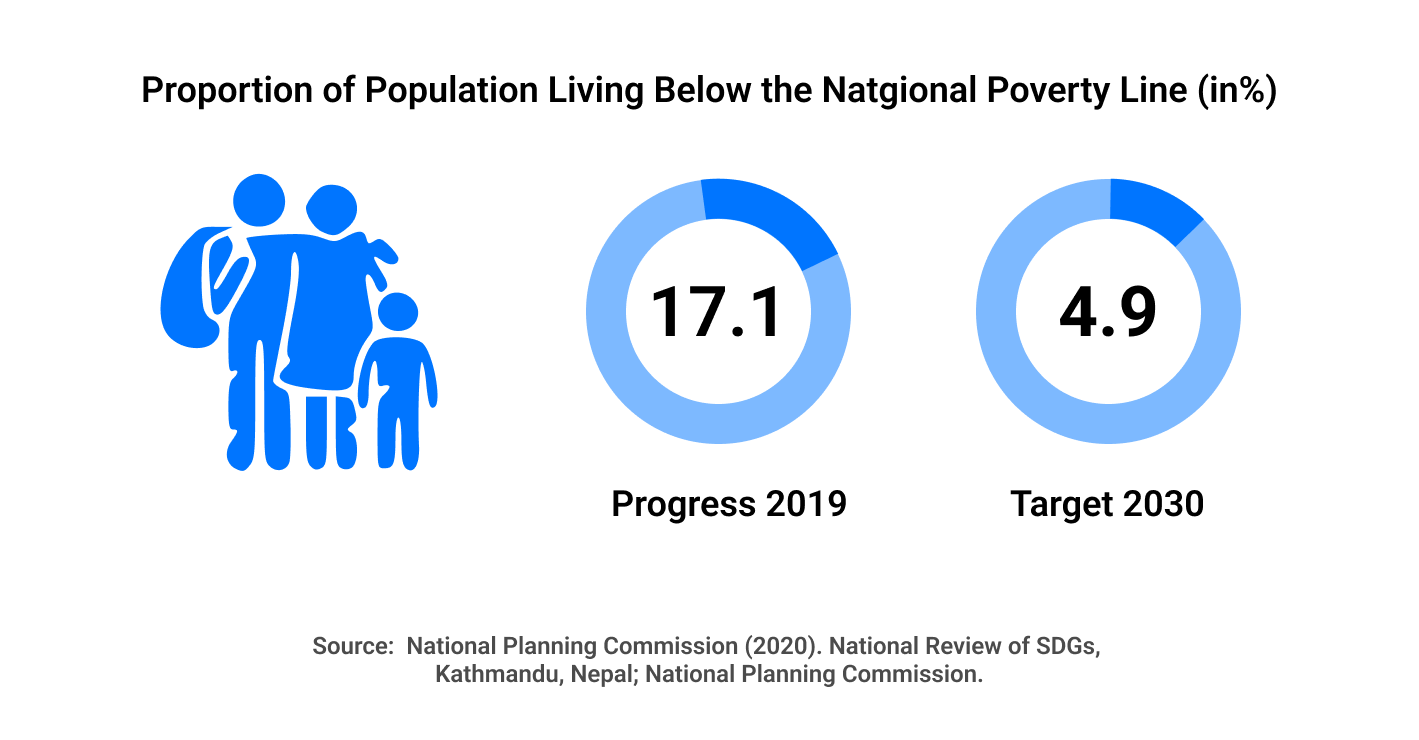
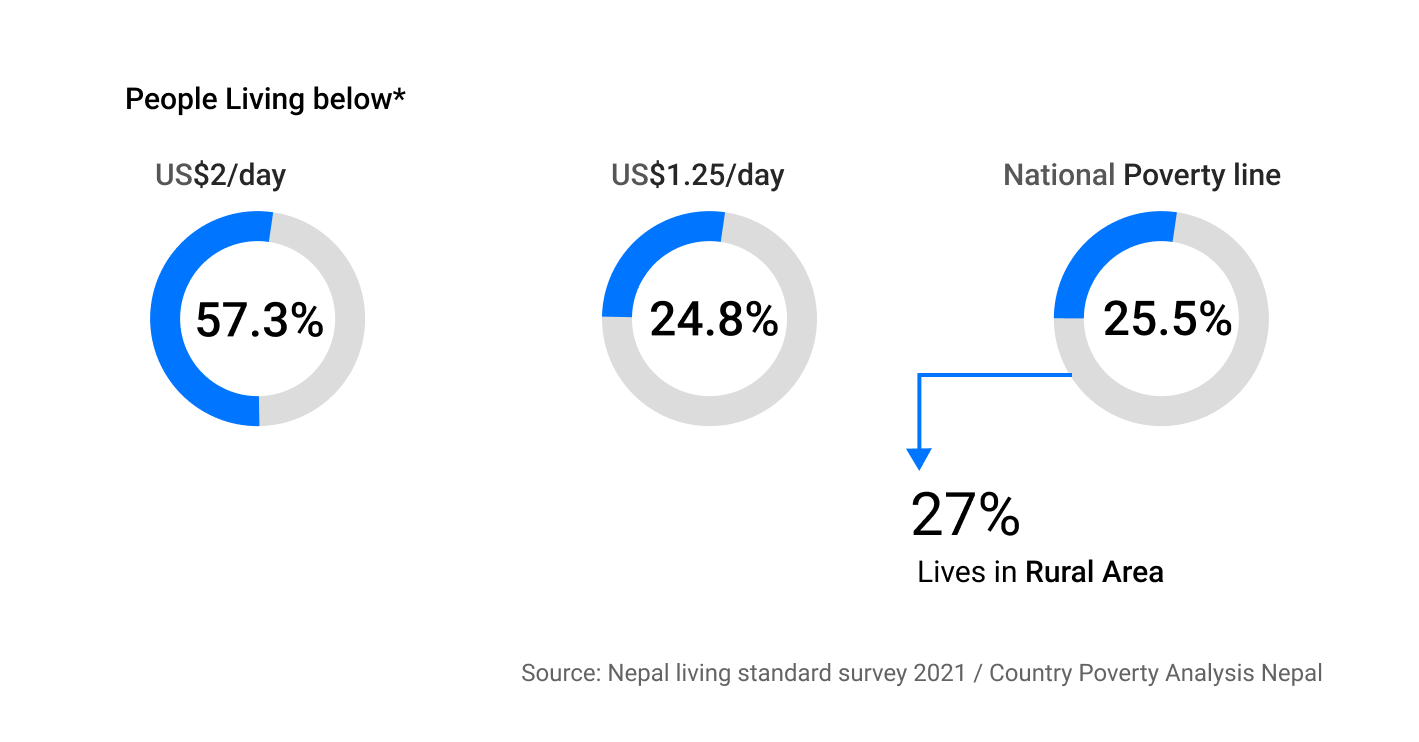
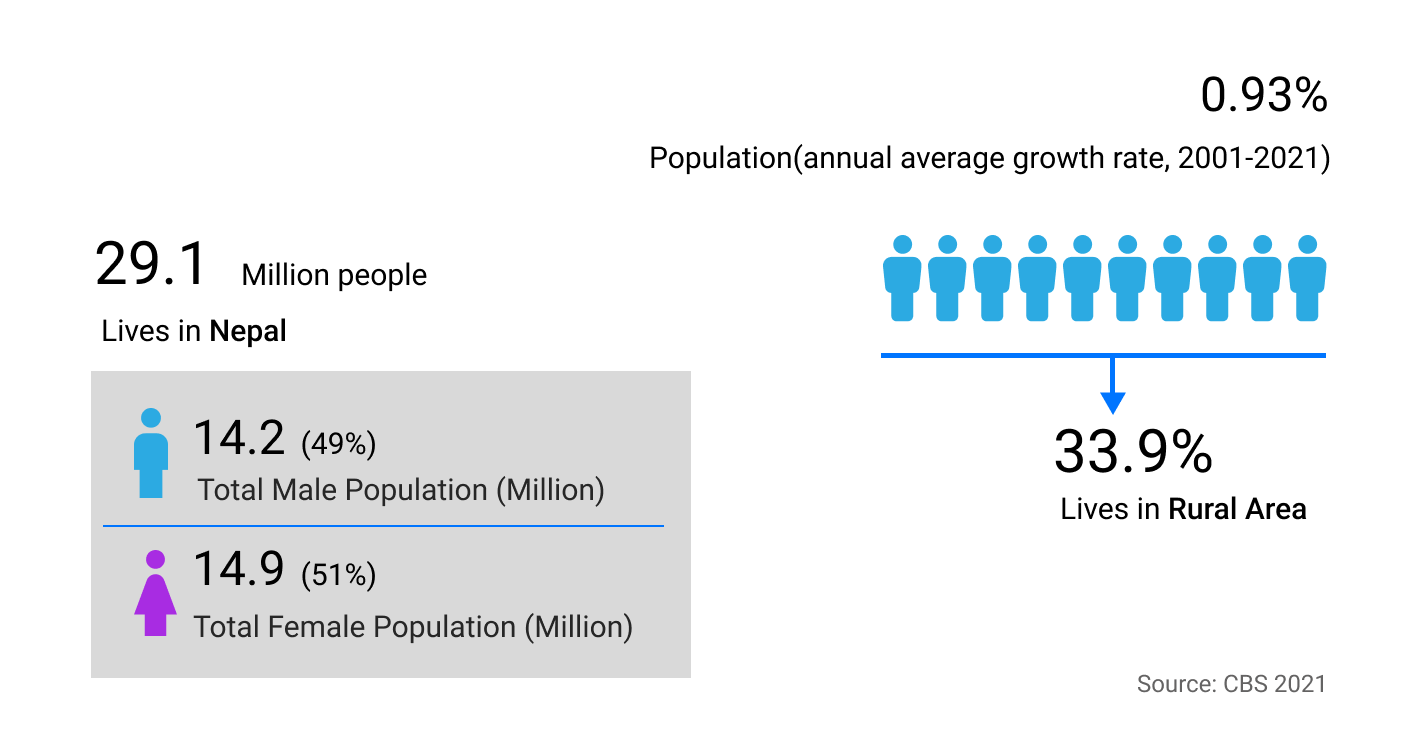
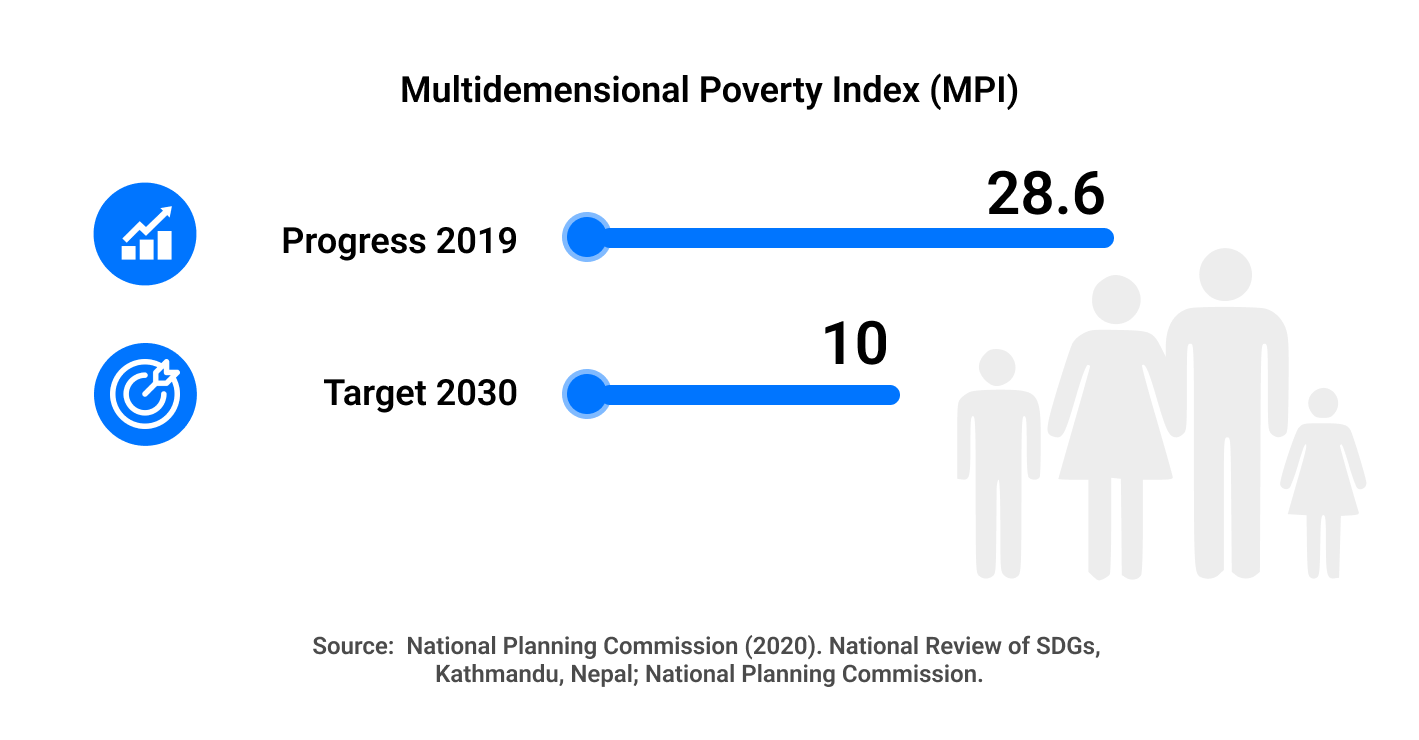
Nepal, a country of 29.2 million, is one of the Least Developed Countries (LDC) and ranks 142 on the Human Development Index. The population living under the national poverty line is estimated at 23.8 percent in 2013 which is a decline from 42 percent in 1996. The population living under the international poverty line of $1.25 per day has declined steadily from 68.0% in 1996 to 53.1% in 2004 24.8% in 2011 (NLSS 2011, Country Poverty Analysis 2013-2017) and 17.4 % in 2017. The more holistic Multidimensional Poverty Index (MPI) likewise shows a decline, from 30.1 percent in 2014 to 17.4 percent, and MPI dropped from 0.133 to 0.074, being cut by nearly half in a mere five years. This is a remarkable result, given that the SDG aim is to cut multidimensional poverty by half in fifteen years. Significant gains toward poverty reduction have been achieved in the country over time, but income inequality has remained a major challenge. Despite the marked reduction, in multidimensional poverty, still, 4.9 million people are multi-dimensionally poor, which is 17.4% of Nepal’s population (MPI Report, 2021). With a hopeful stride towards development, Nepal has set a target to graduate from the status of an LDC) by 2022. Similarly, poverty in rural Nepal is still higher than in urban Nepal, even though rural poverty is declining at a faster pace than urban poverty. While urban poverty fell from 21.6% in 1996 to 10.0% in 2004, it again rose to 15.5% in 2011. On the other hand, rural poverty has declined continuously from 43.3% to 35.0% and 27.4% between 1996, 2004, and 2011.

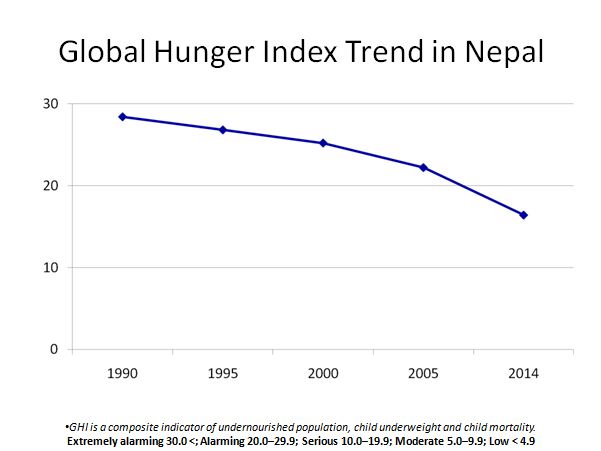
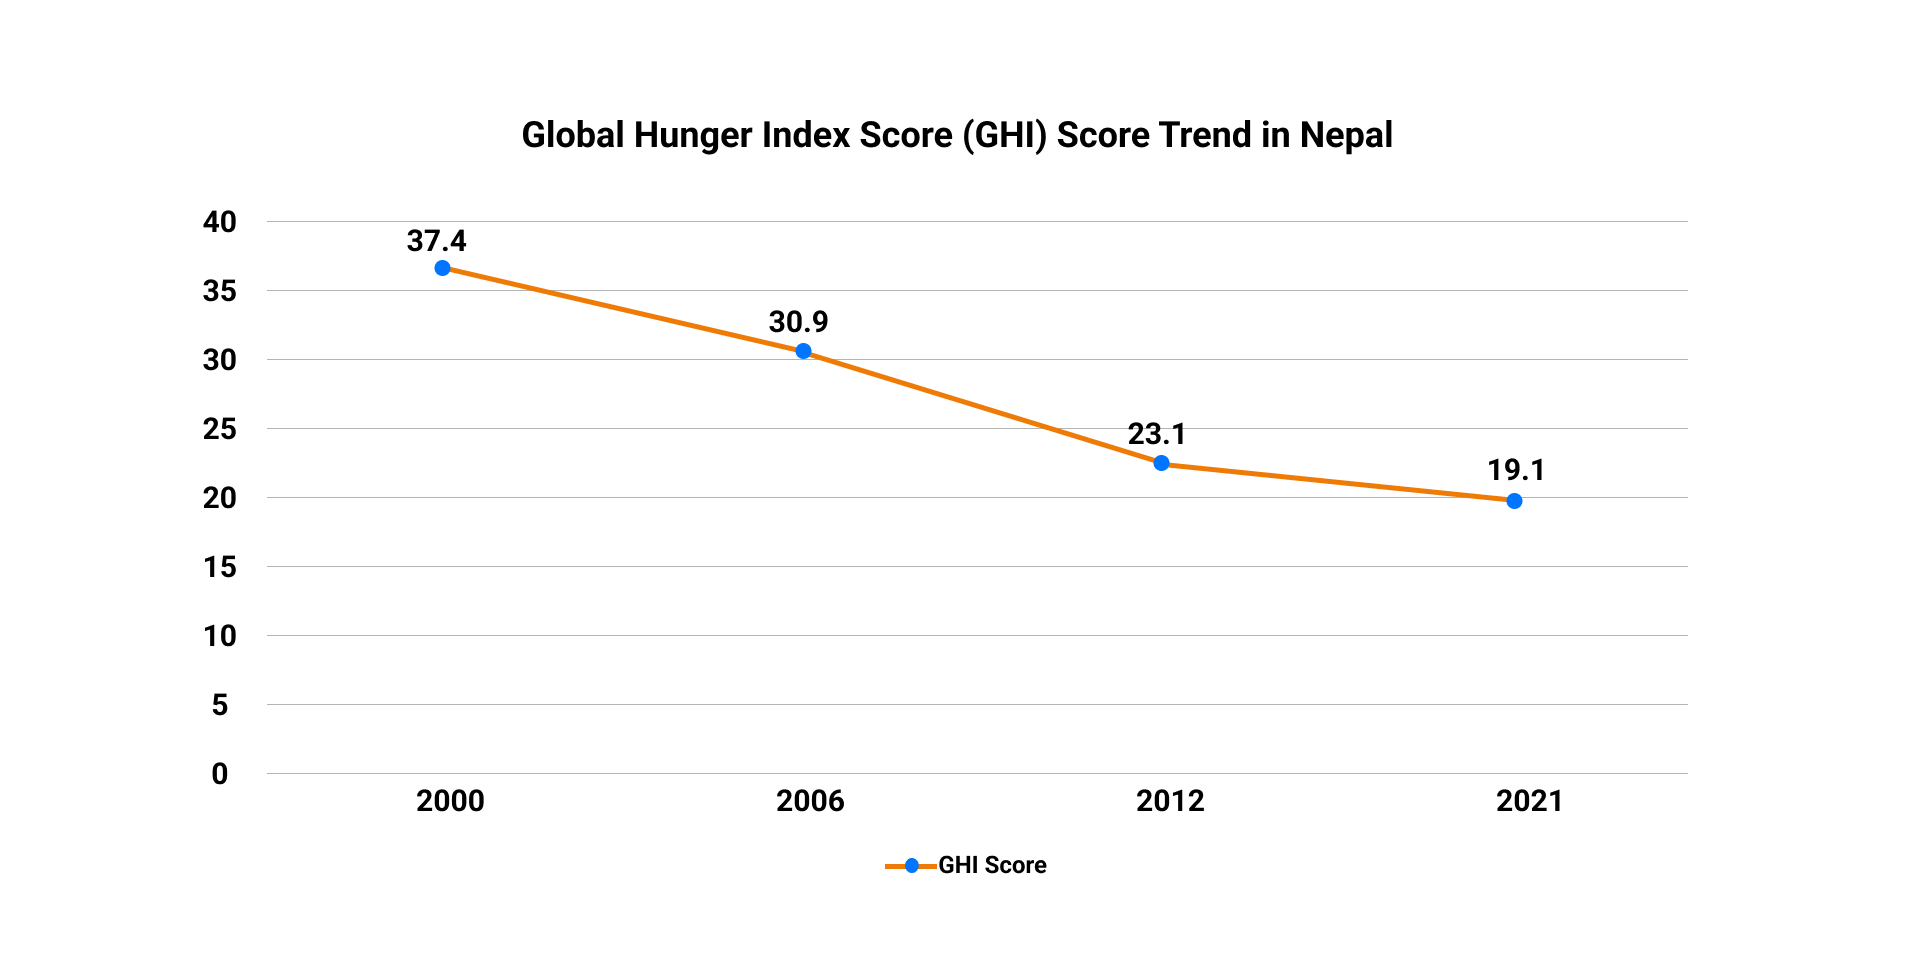
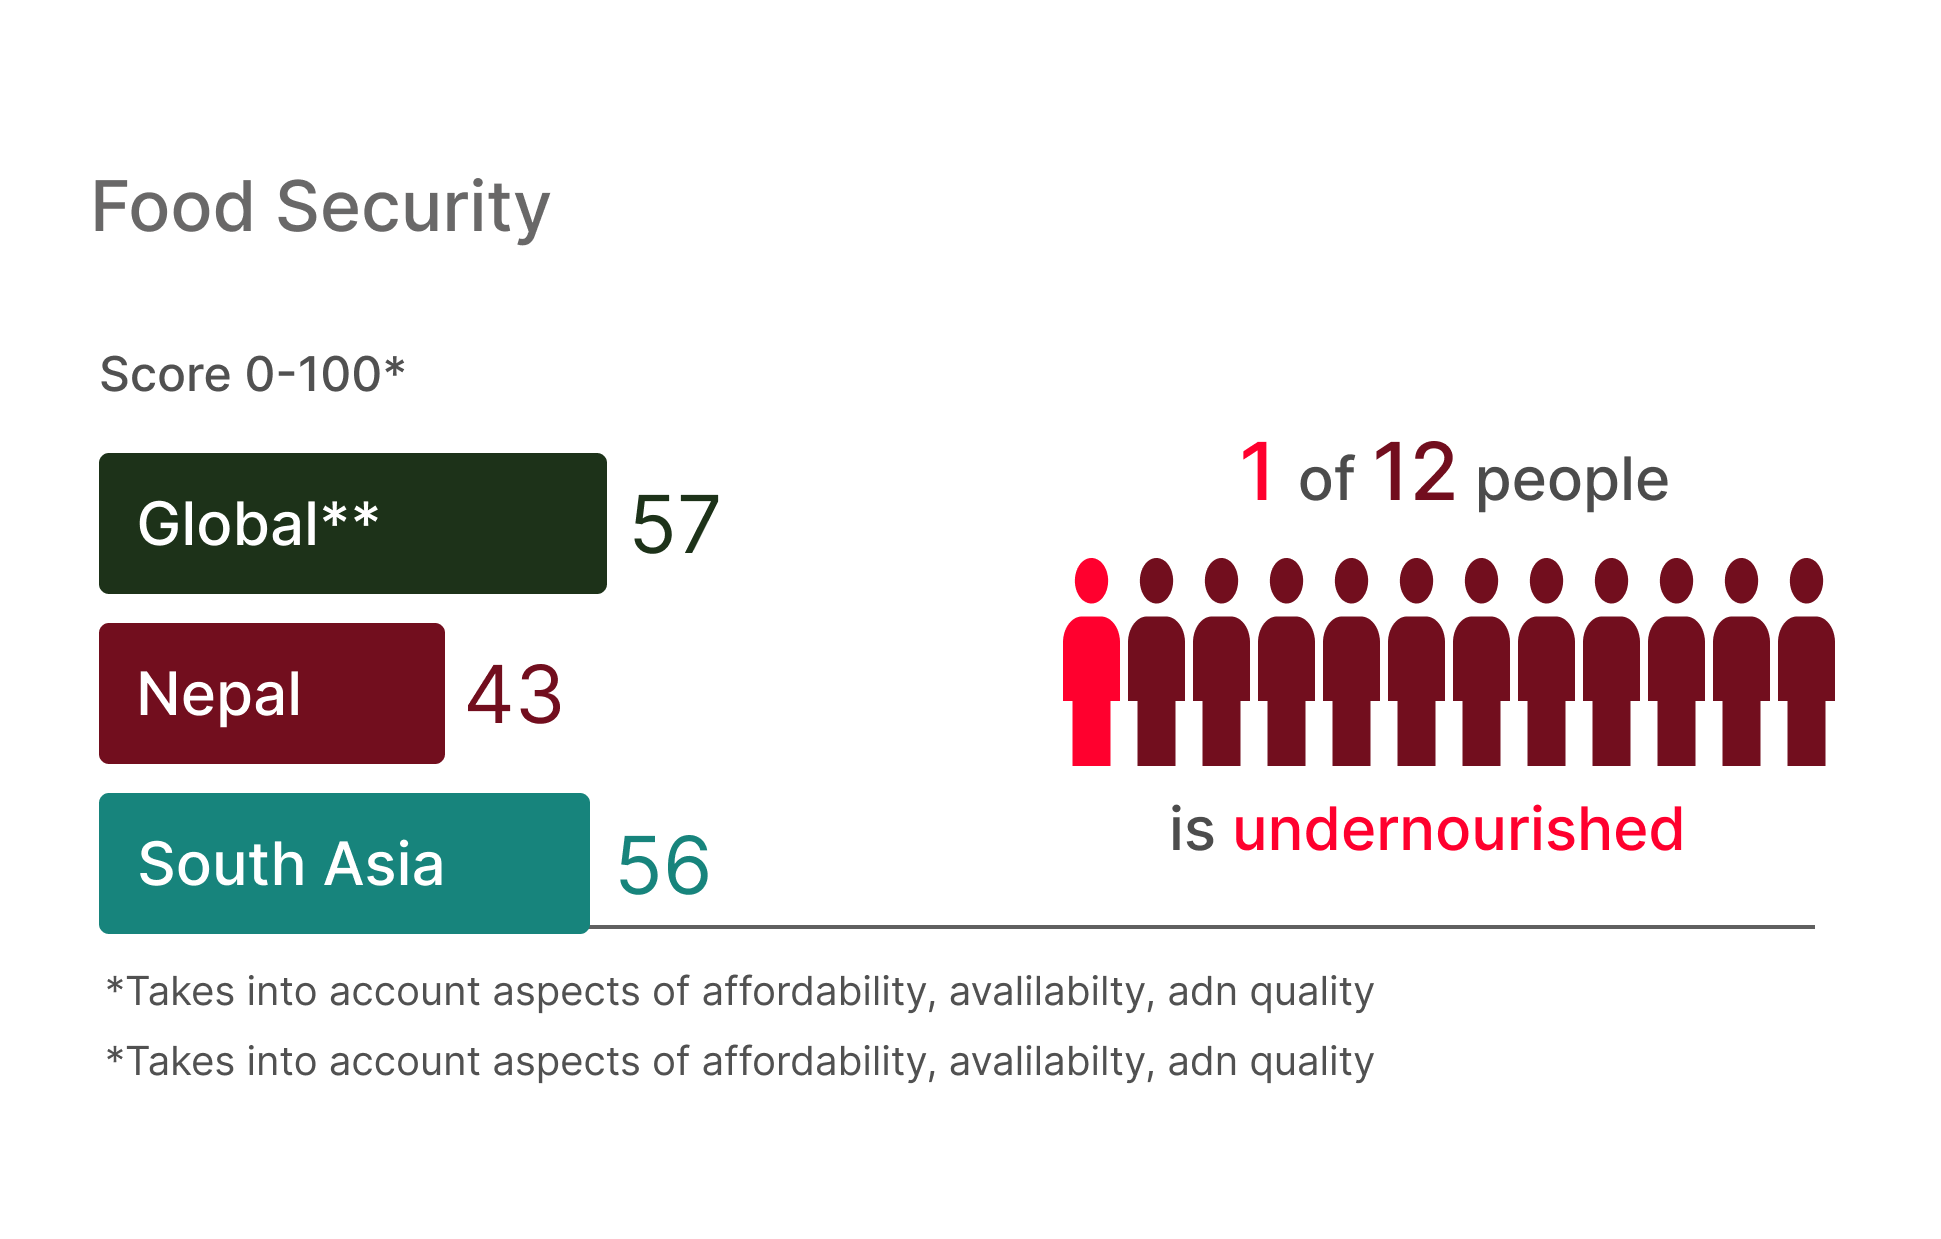
Poor nutrition and food insecurity have remained challenges and impediments to development in Nepal. Poverty is one of the important determinants of food insecurity and poor nutrition. Food security situation has improved in recent years. The Global Hunger Index, which is a multidimensional approach to measuring hunger, ranked Nepal as 76 out of 114 countries in 2021. Nepal’s Global Hunger Index score was 19.5 in 2021 down from 37.4 in 2000, shows improvement compared to the past and the country is no longer in the "alarming” category (Figure 3). However, it is still classified as “moderate” showing that despite improvements, food and nutrition insecurity is still a cause for concern.

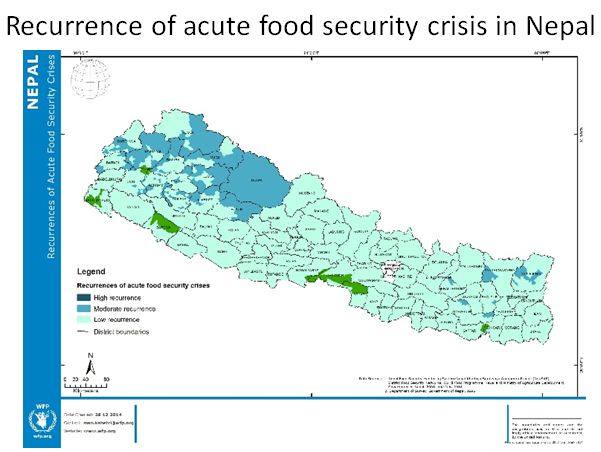
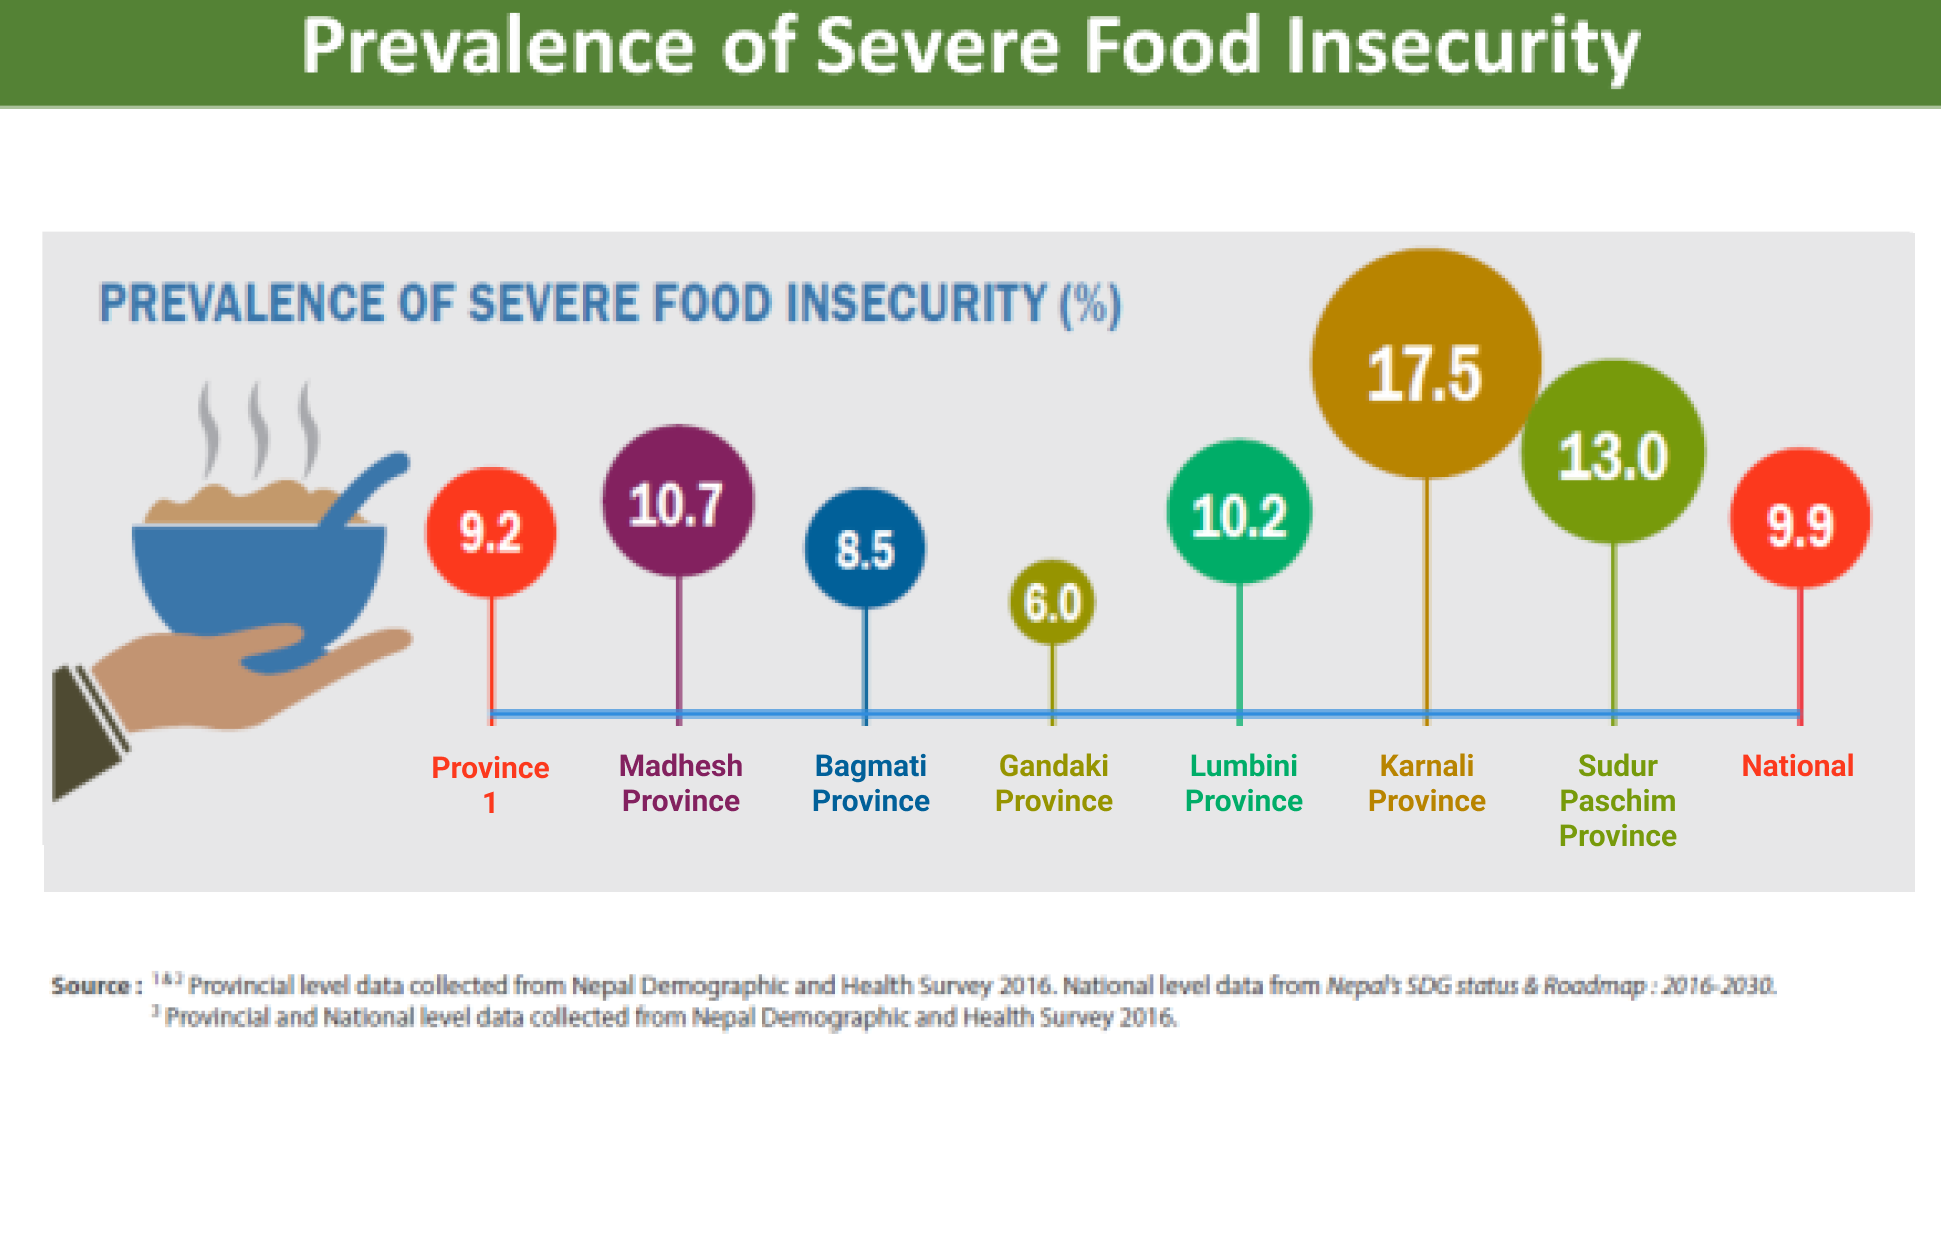
Despite the improvement in the food security, still 4.6 million people in Nepal are food-insecure, with 20 % of households mildly food-insecure, 22 % moderately food-insecure, and 10 % severely food-insecure (NDHS, 2016). Households in rural areas of the country—where comparatively higher proportion of poor reside and food prices tend to be higher—are more likely to be food-insecure. Compared to urban areas (9 percent) higher proportion of households in rural areas (12 percent) are severely food insecure (NDHS, 2016). Rural areas particularly in the remote and low productive areas are more food insecure where rain- fed subsistence agriculture is more pervasive. The lowest cost nutritious diet is more than twice as expensive as a diet that meets only energy needs (NPR 348 for nutritious diet vs NPR 141 for energy only diet). According to 2021 Fill the Nutrient Gap (FNG) analysis Report, 22 % of the household wouldn’t be able to afford lowest cost nutritious diet. Moreover, access and cost of these nutritious foods differ widely across Nepal. Access to nutritious foods is unequal with lower availability and higher prices in the mountain areas compared to the rest of the country.
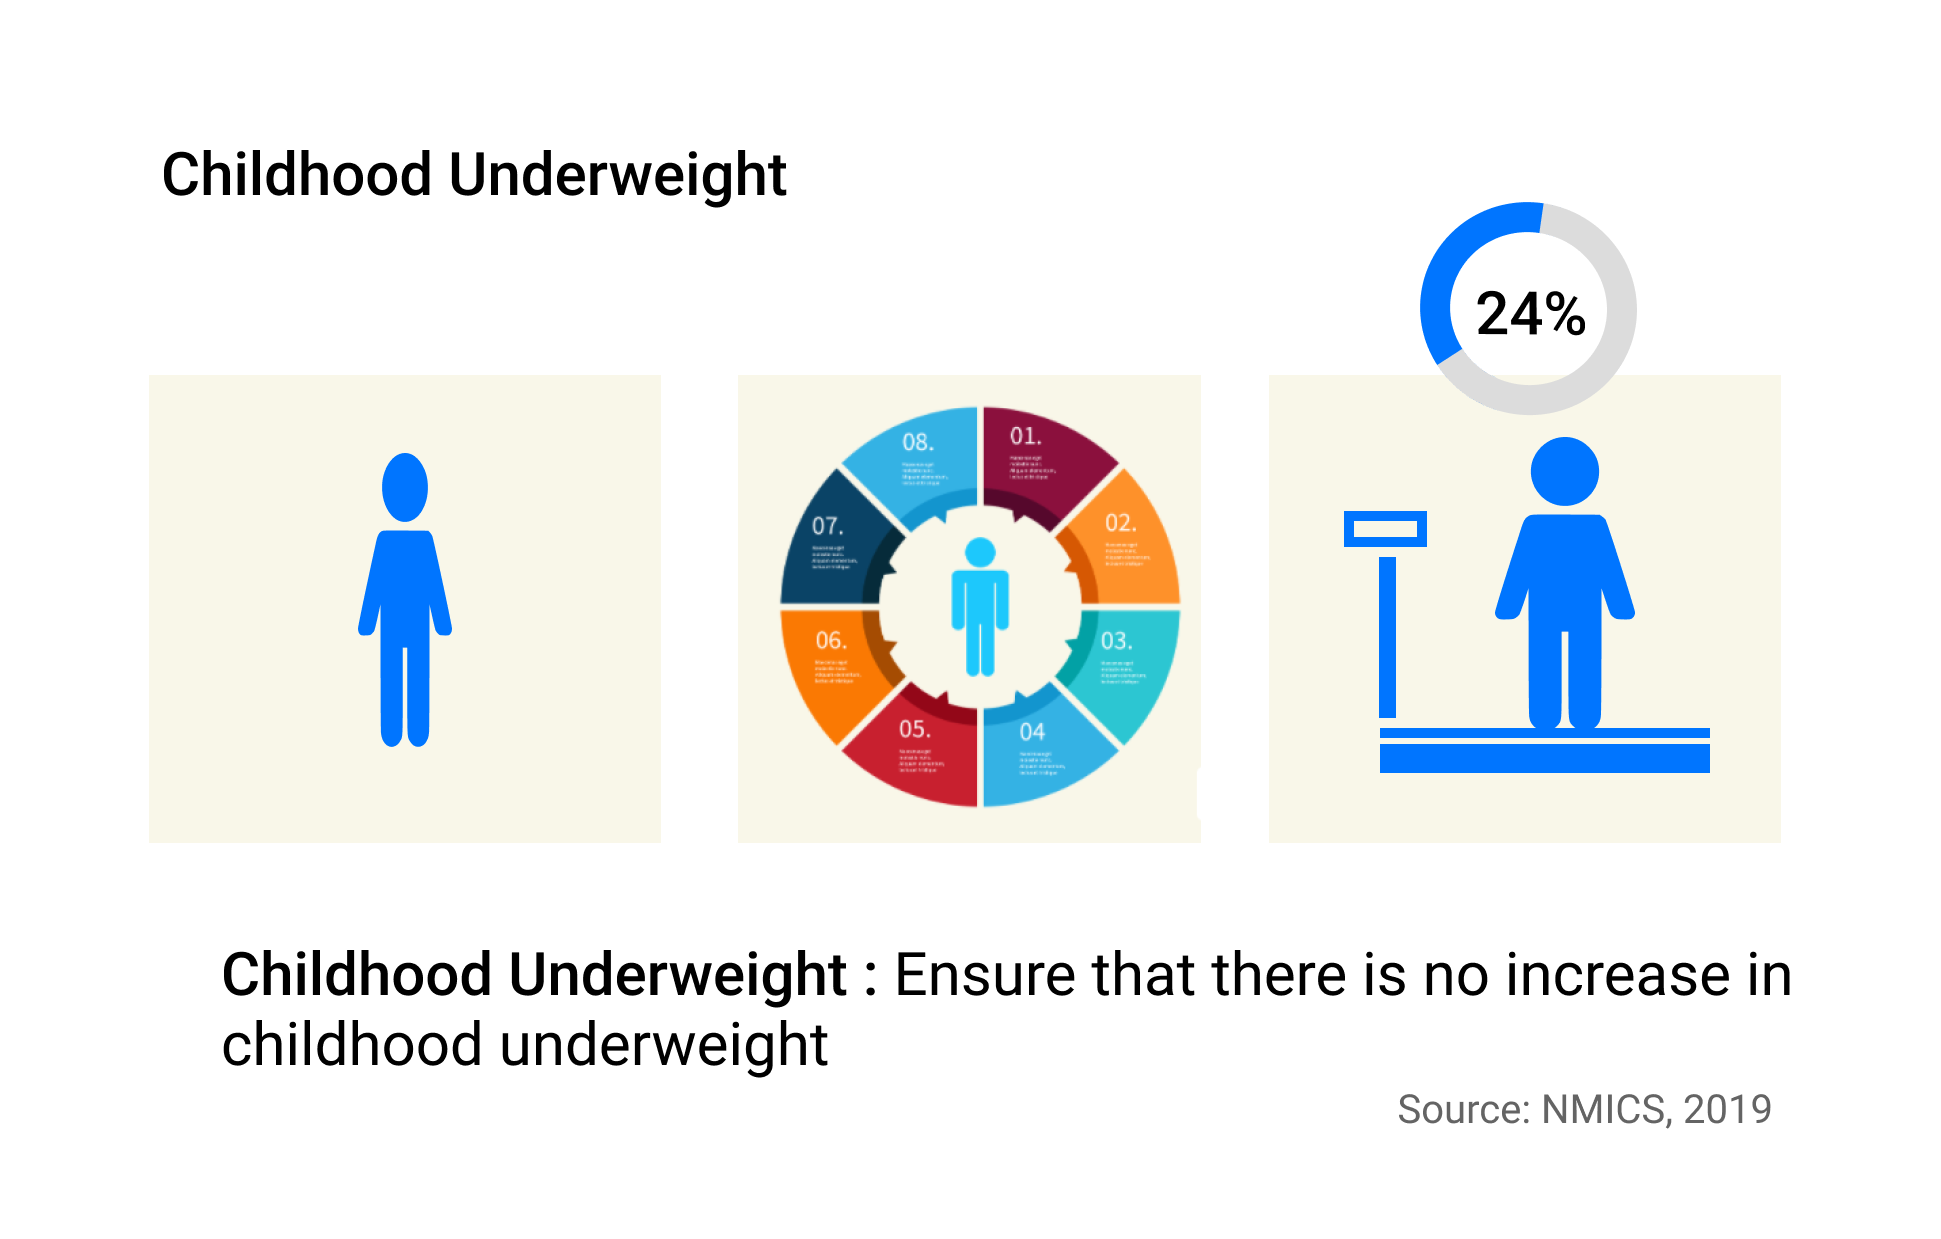
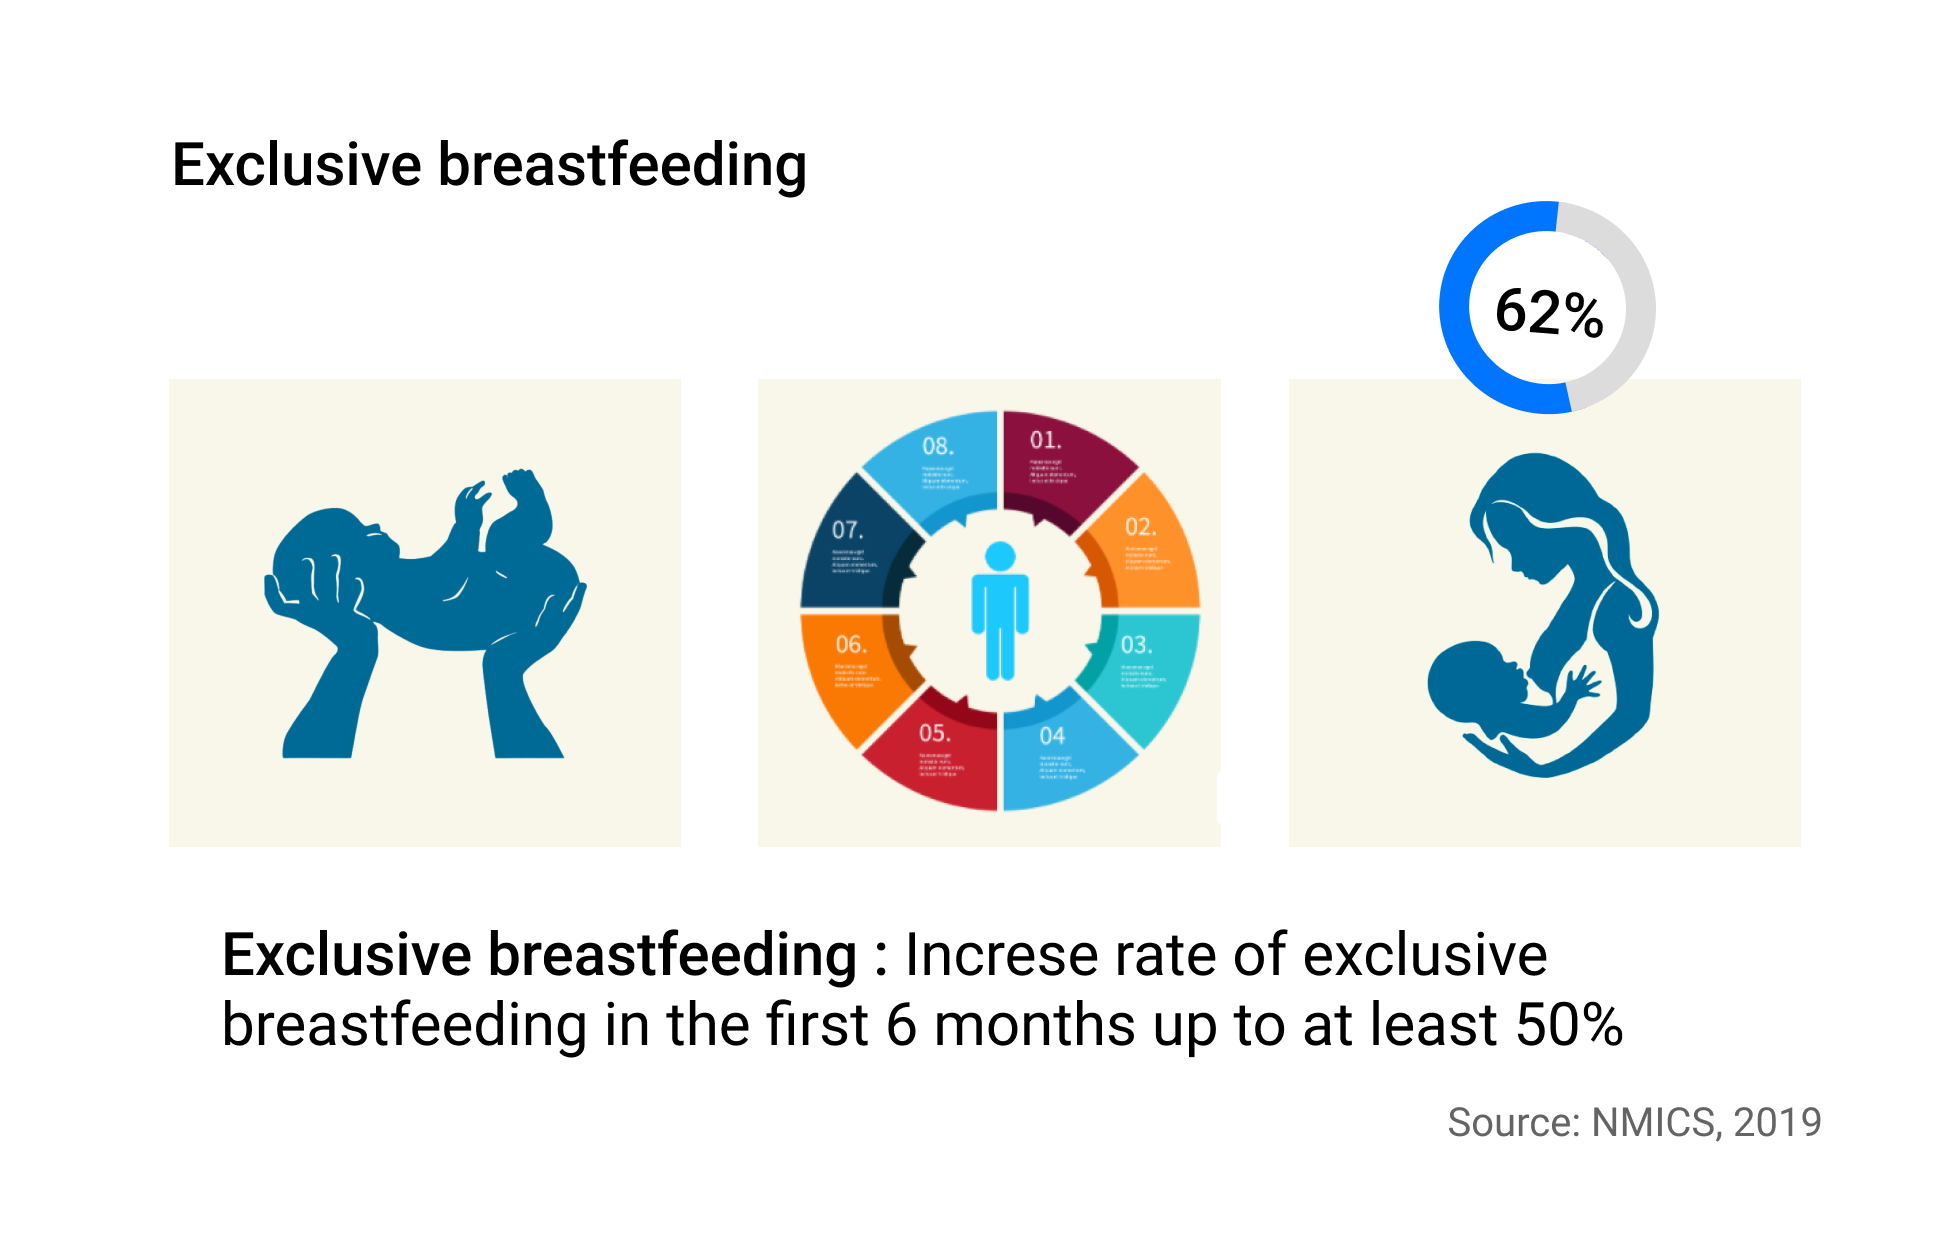
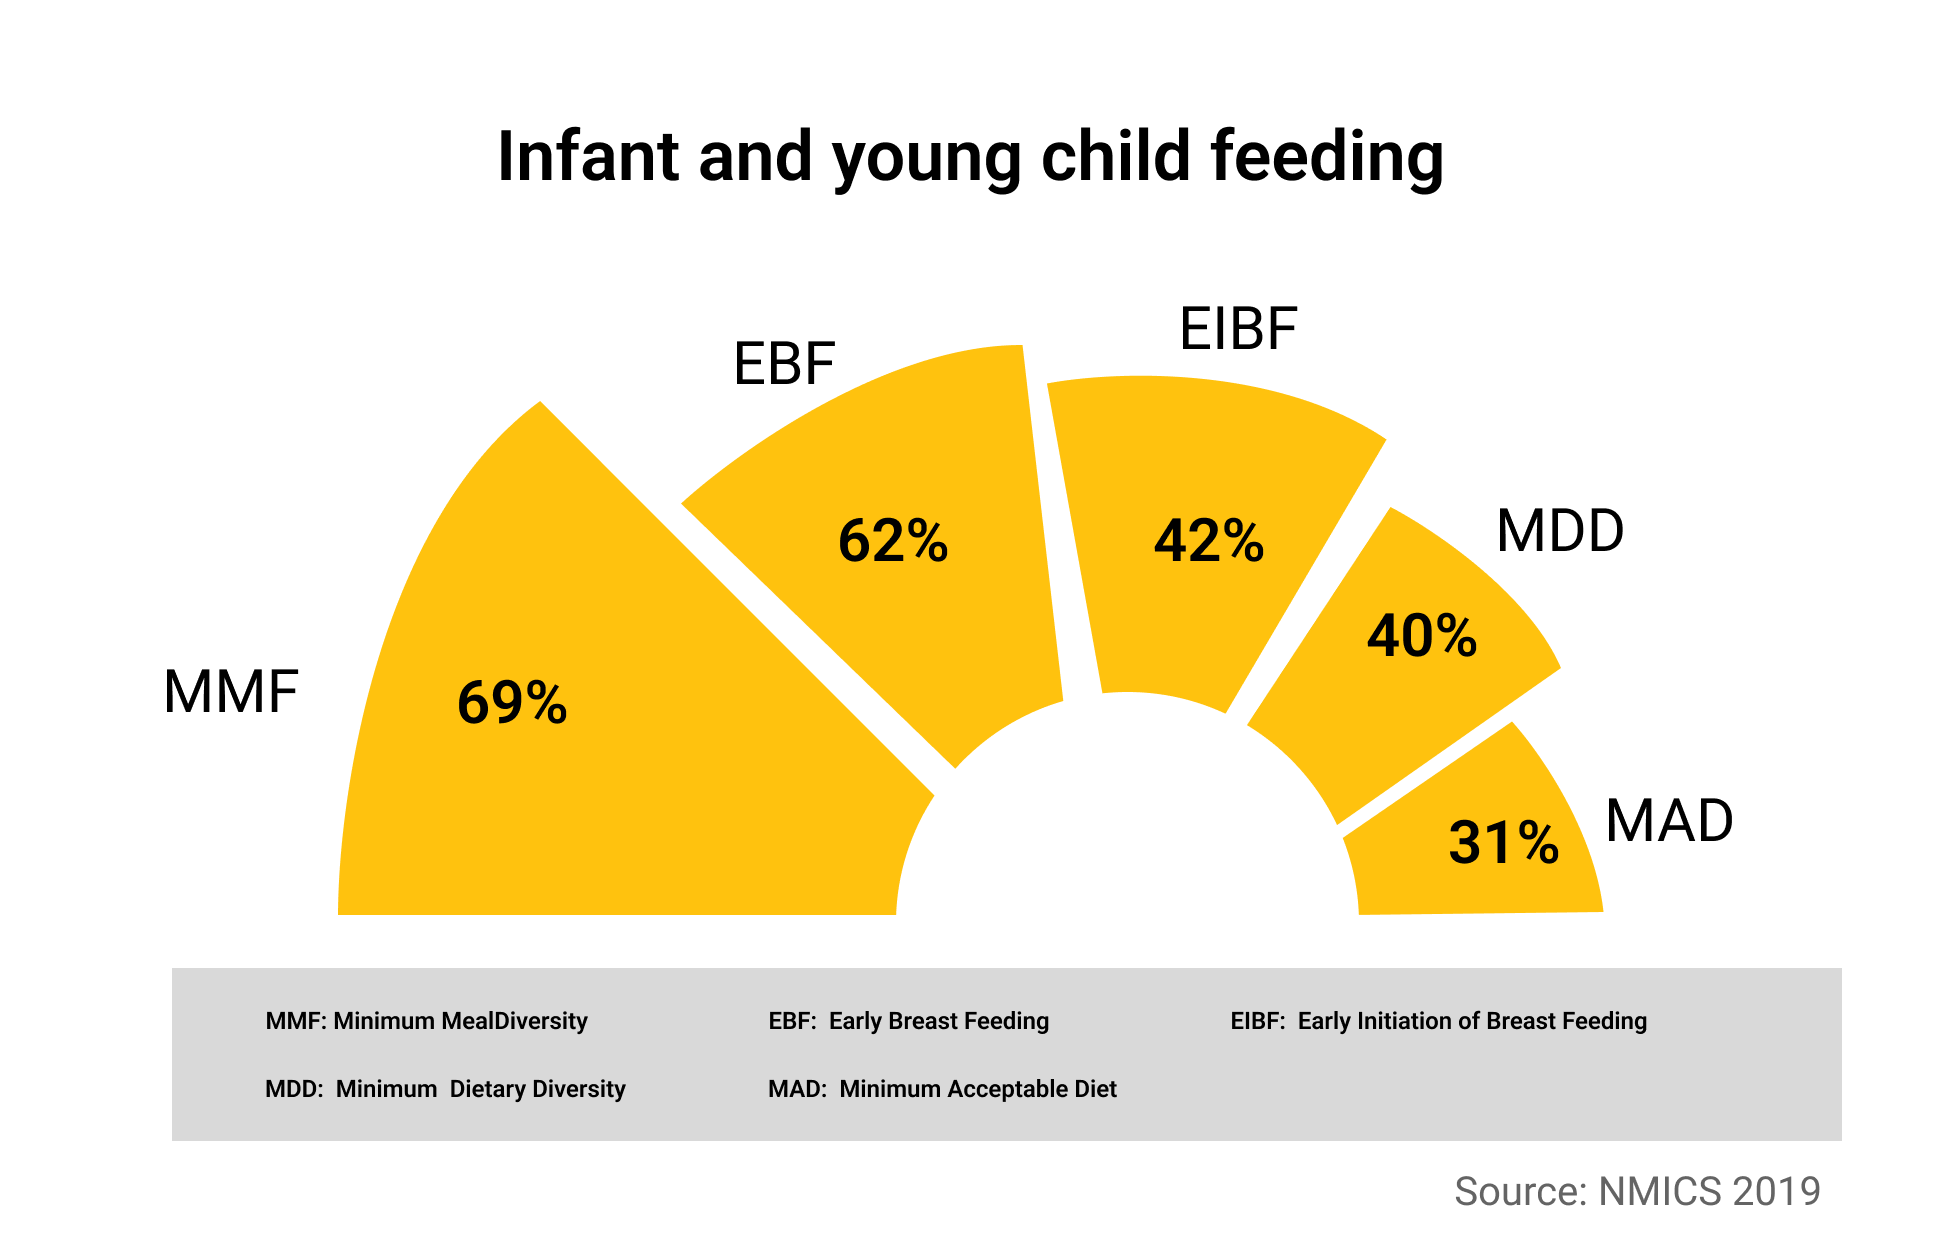
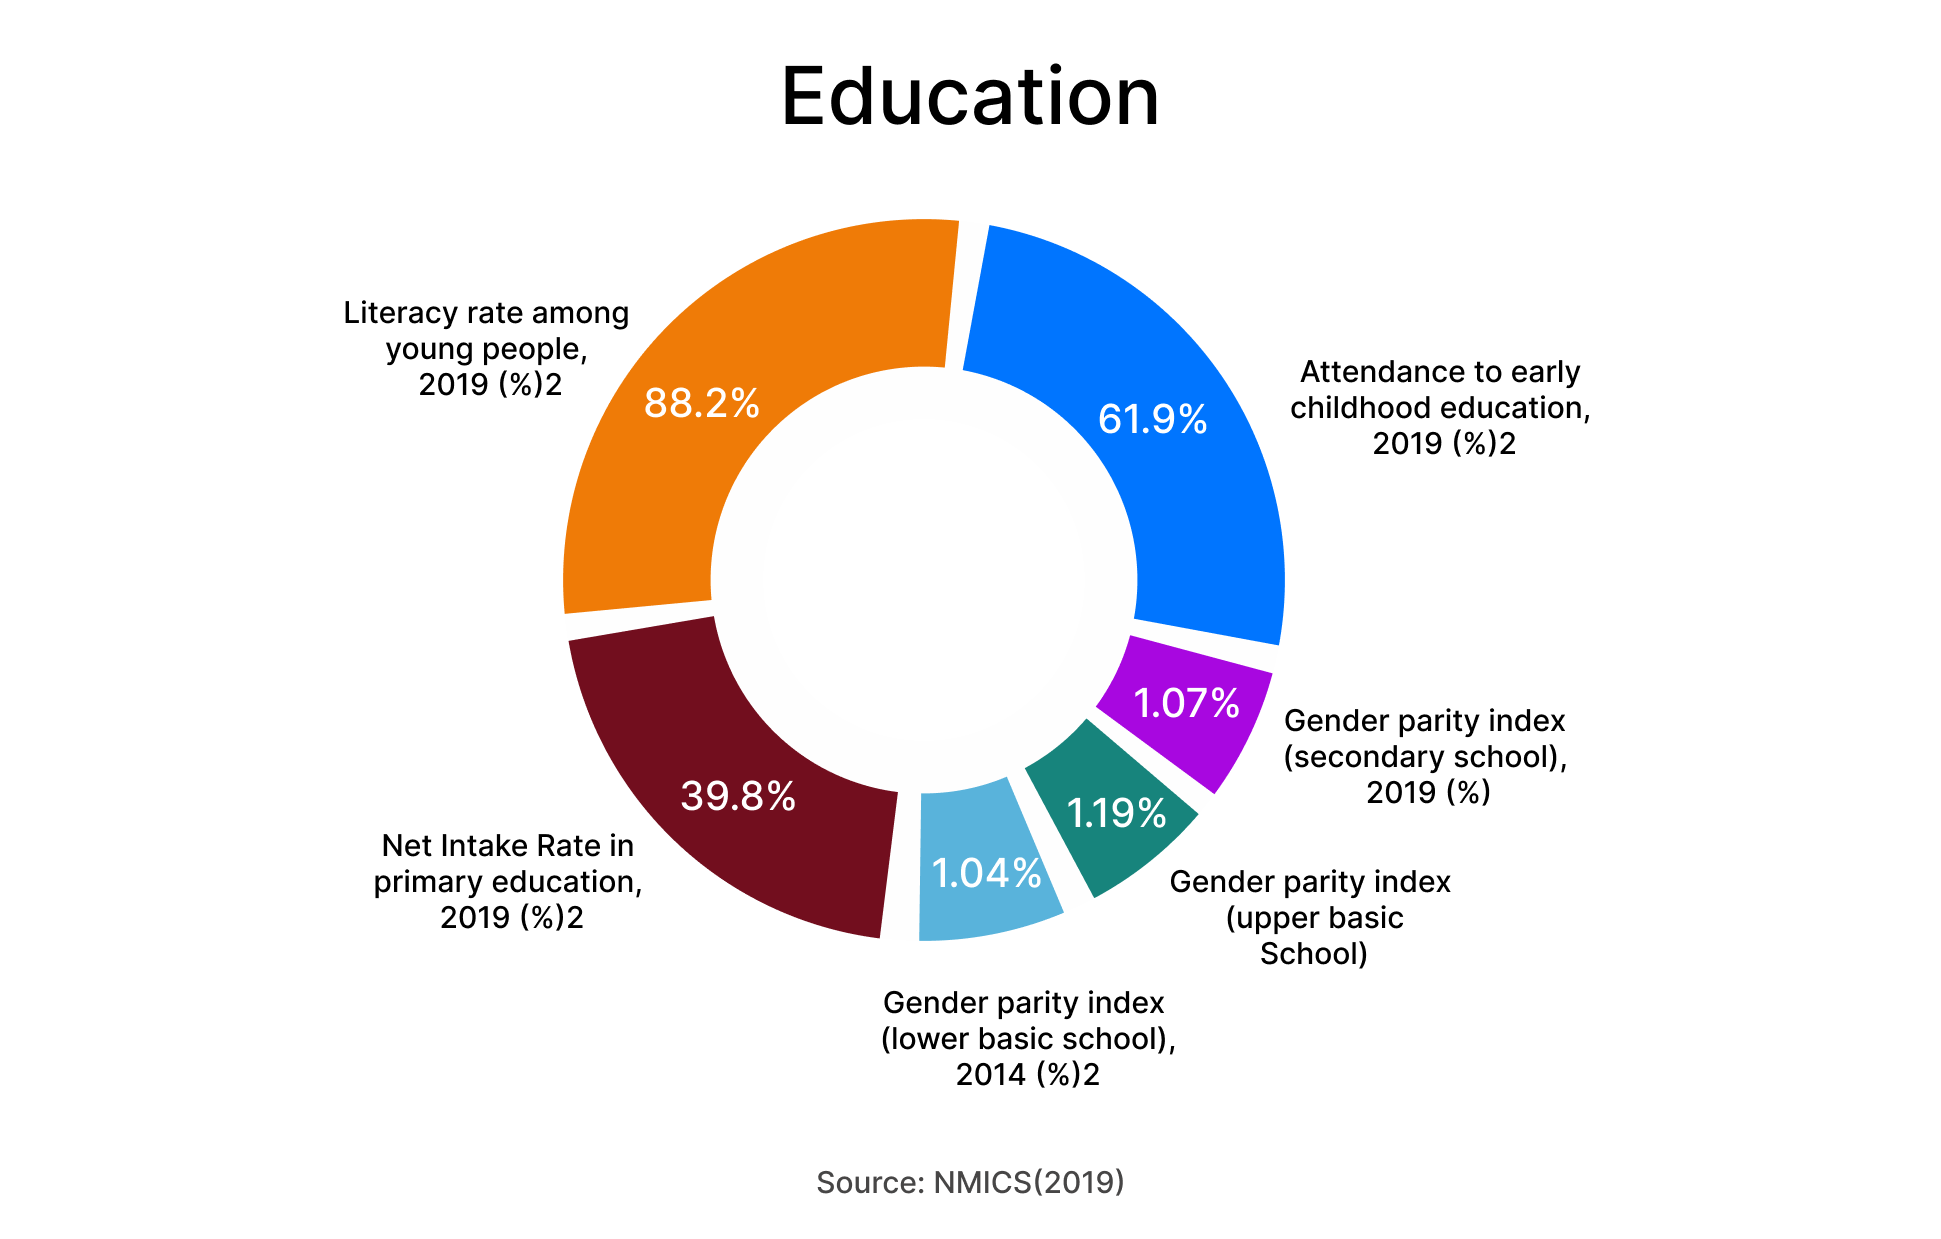
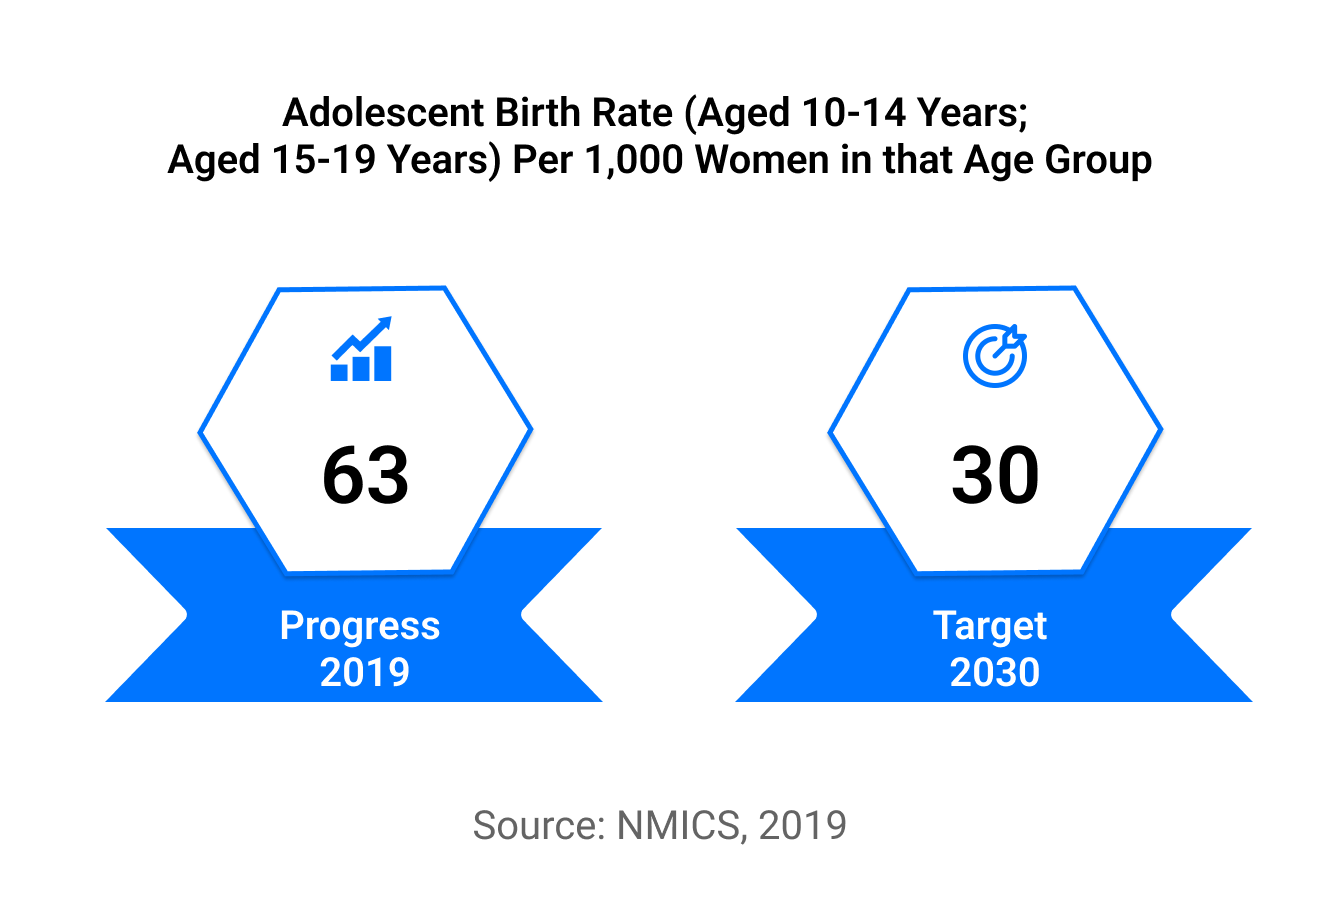
Nepal Living Standard Survey 2011 found that 38 % of Nepali people are living with less than the minimum daily requirement of calories required for a healthy life. A significant disparity prevails between ecological zones, provinces, and the rural-urban divide. Compared to Terai (24 percent), the population living with insufficient calorie intake is higher in hilly (36 percent) and mountainous (38 percent) areas. Moreover, the diets of Nepali children aged 6–23 months are largely suboptimal: just 31 percent receive a minimum acceptable diet (NMICS, 2019). Further, the proportion of children aged 6–23 months receiving the minimum acceptable diet is lowest in the Terai, even though this is the country’s most agriculturally productive region. In addition, by ecological region, hilly and mountainous areas are worst hit by food insecurity and insufficient calorie intake.
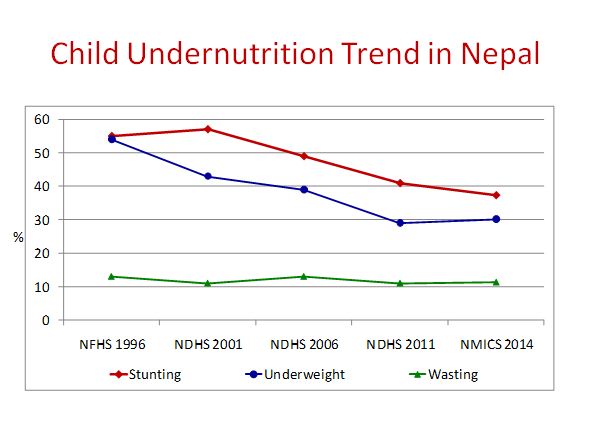
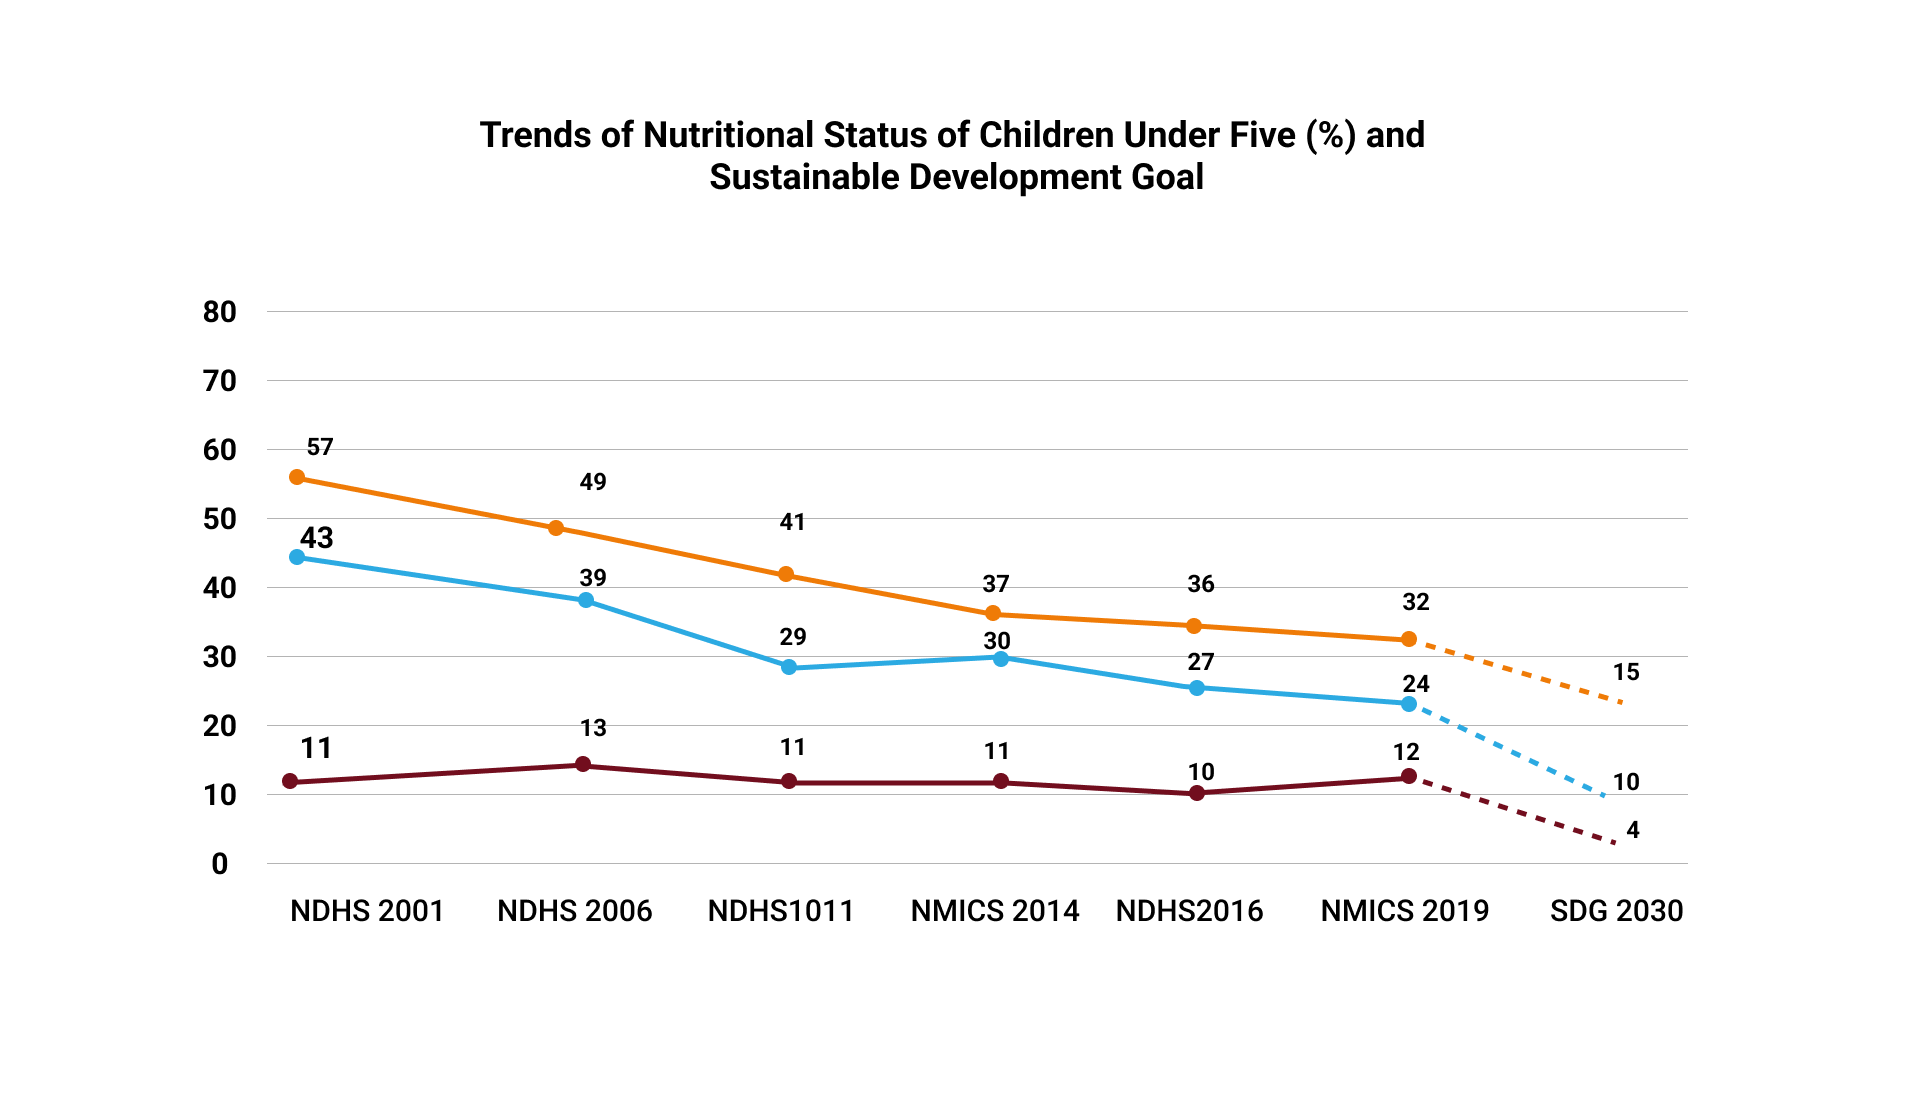
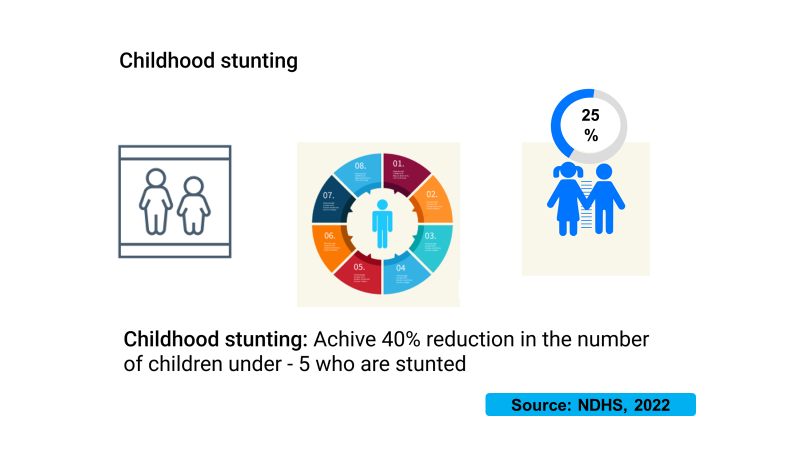
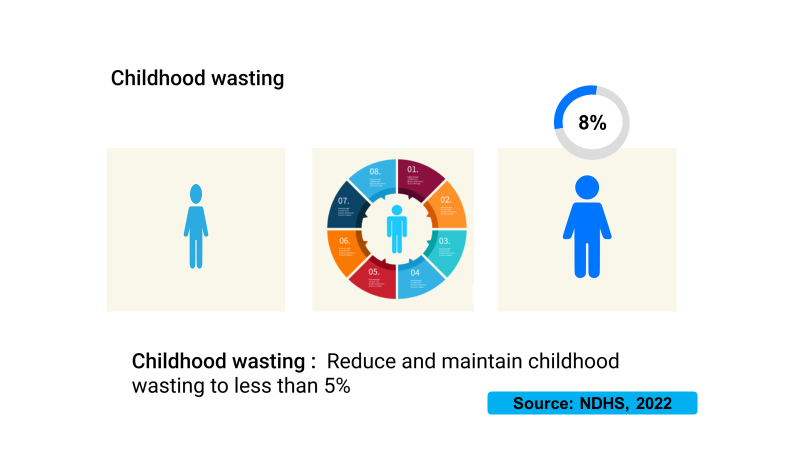
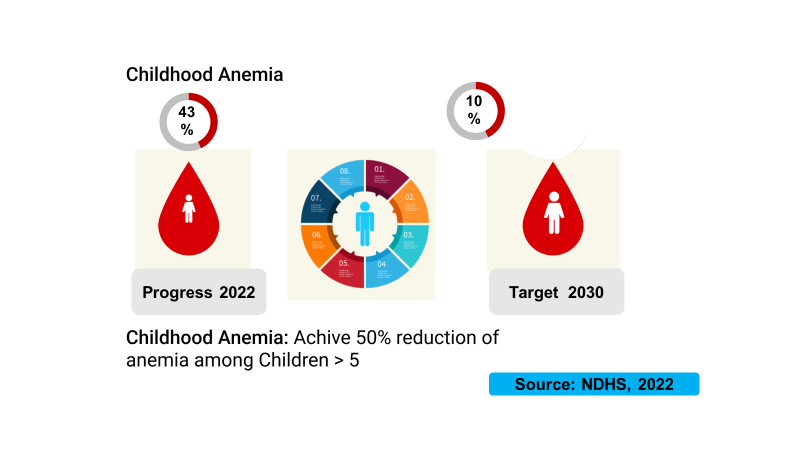
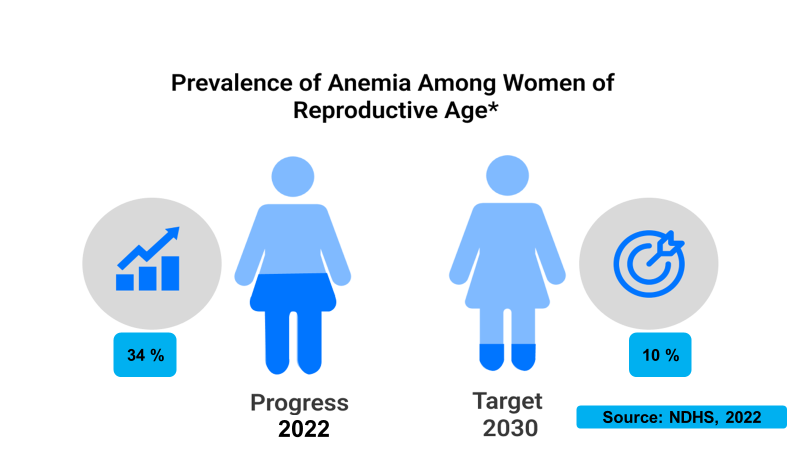
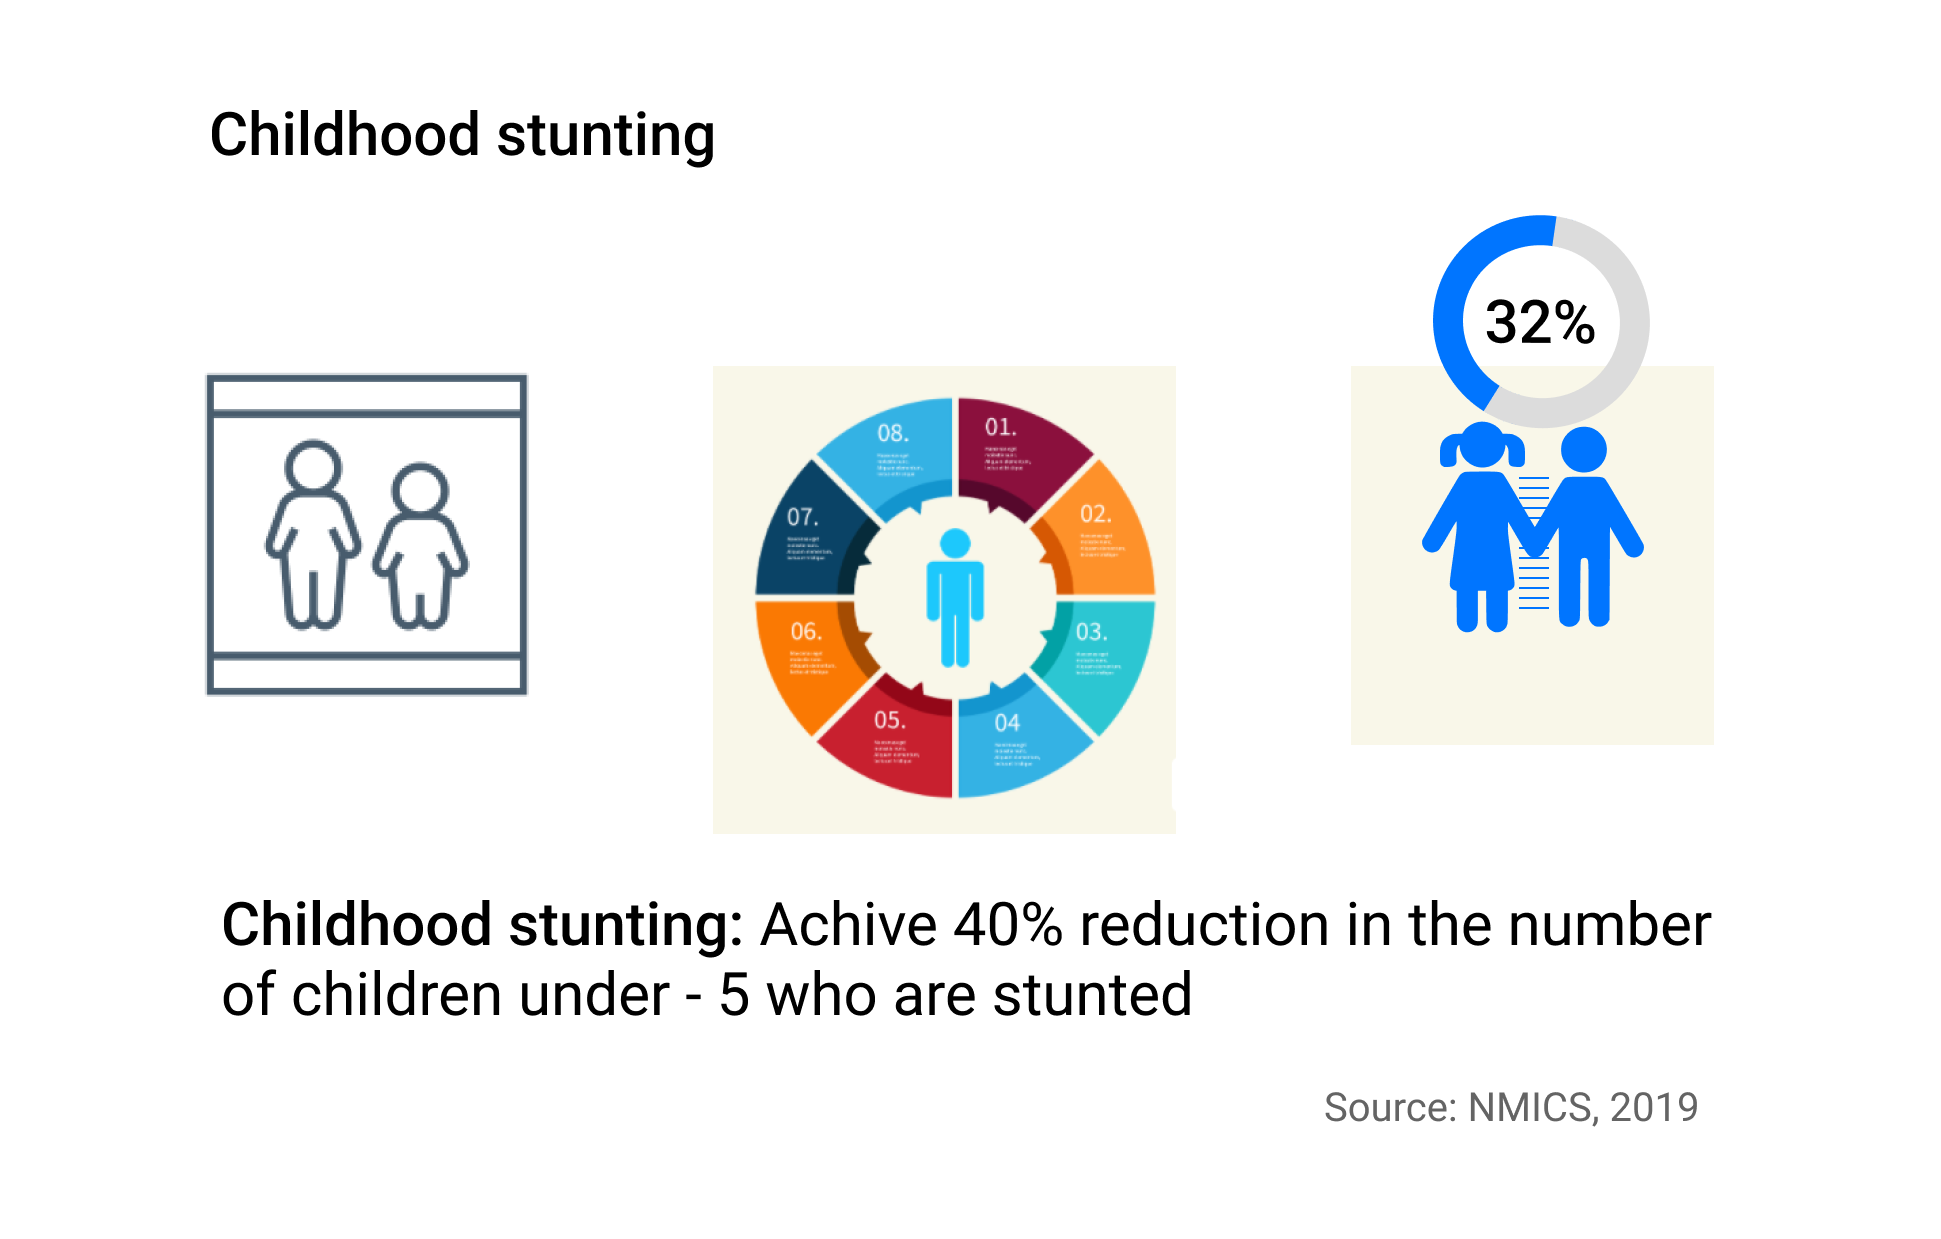
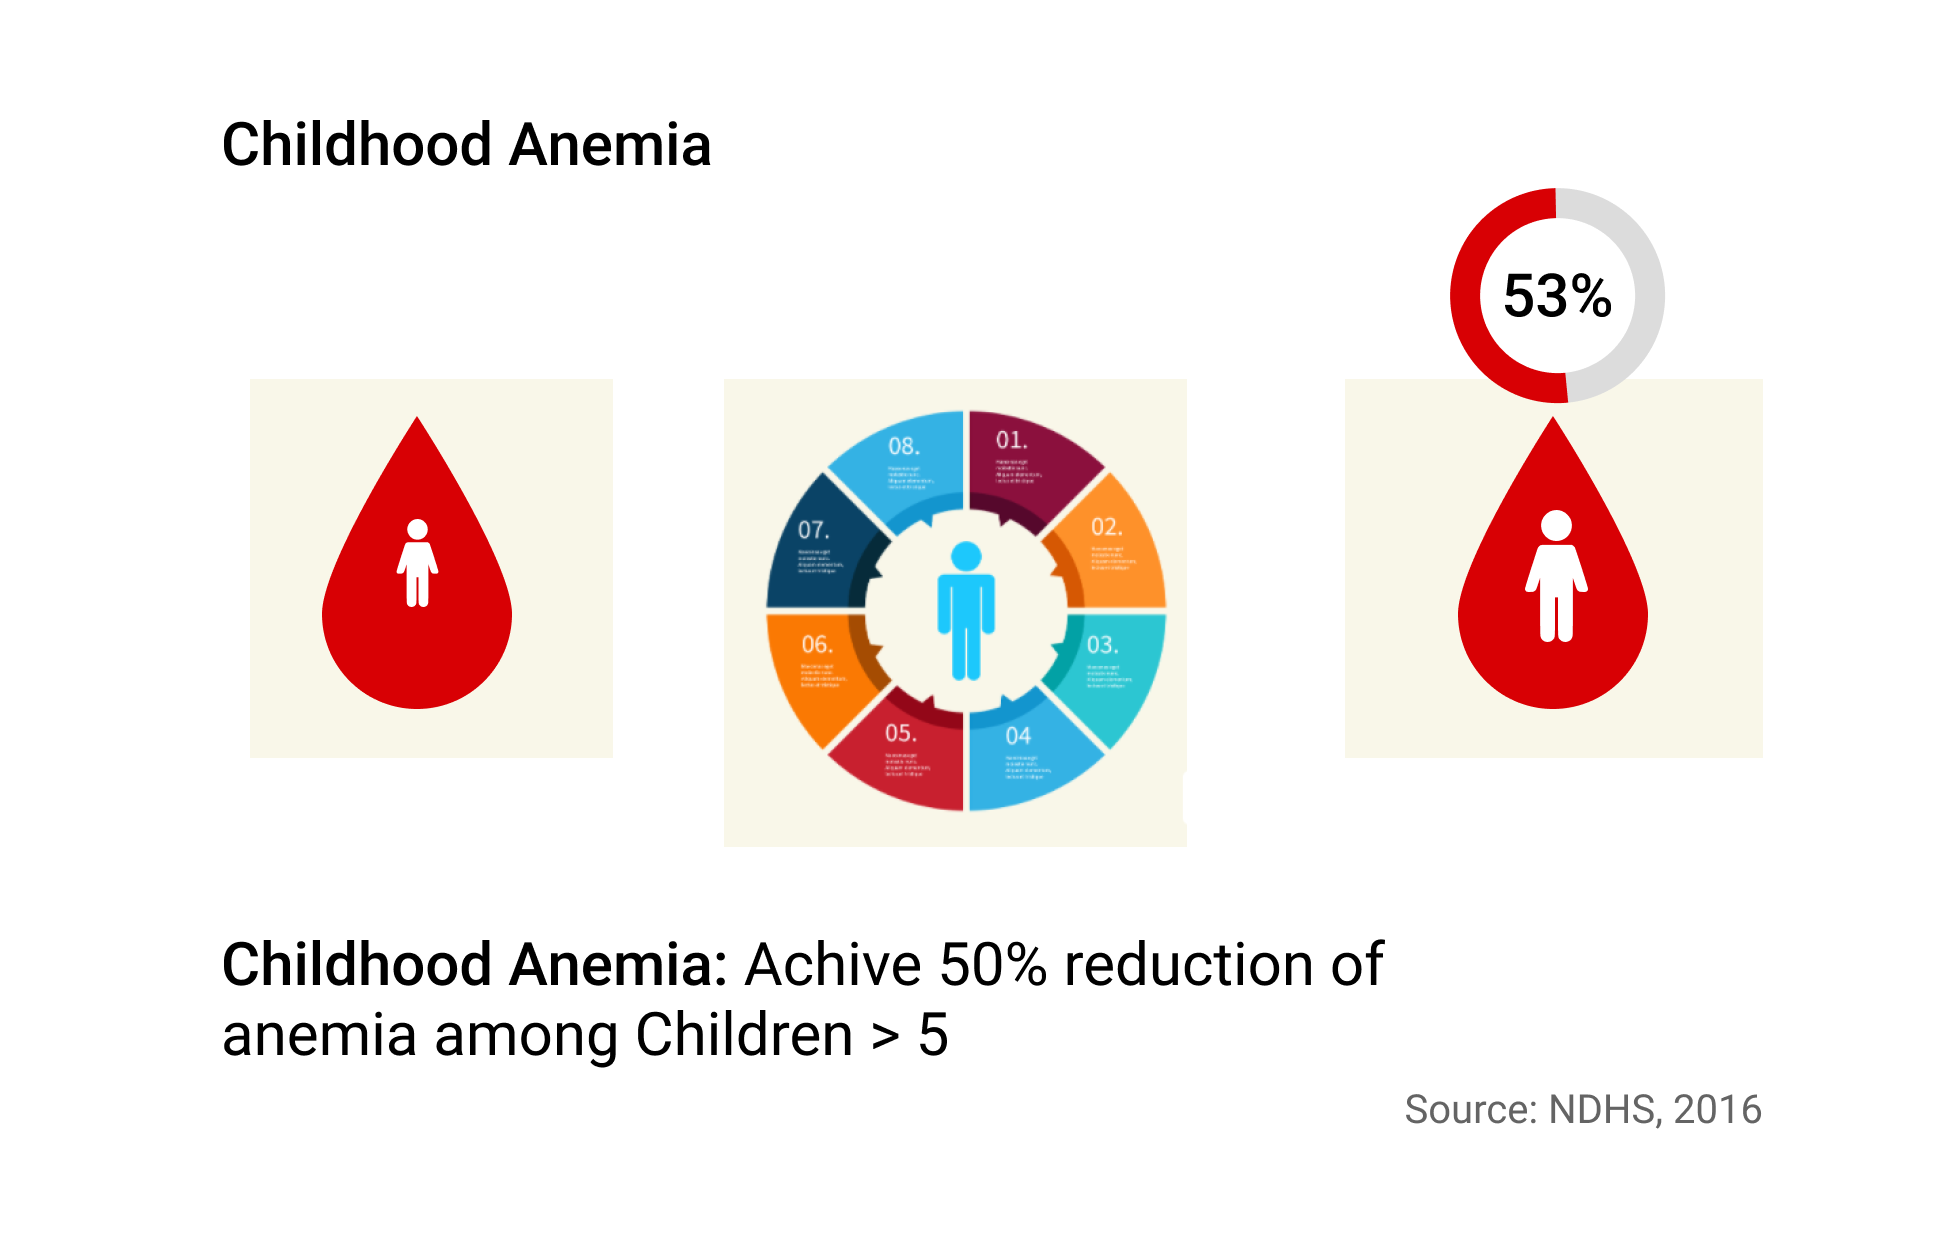
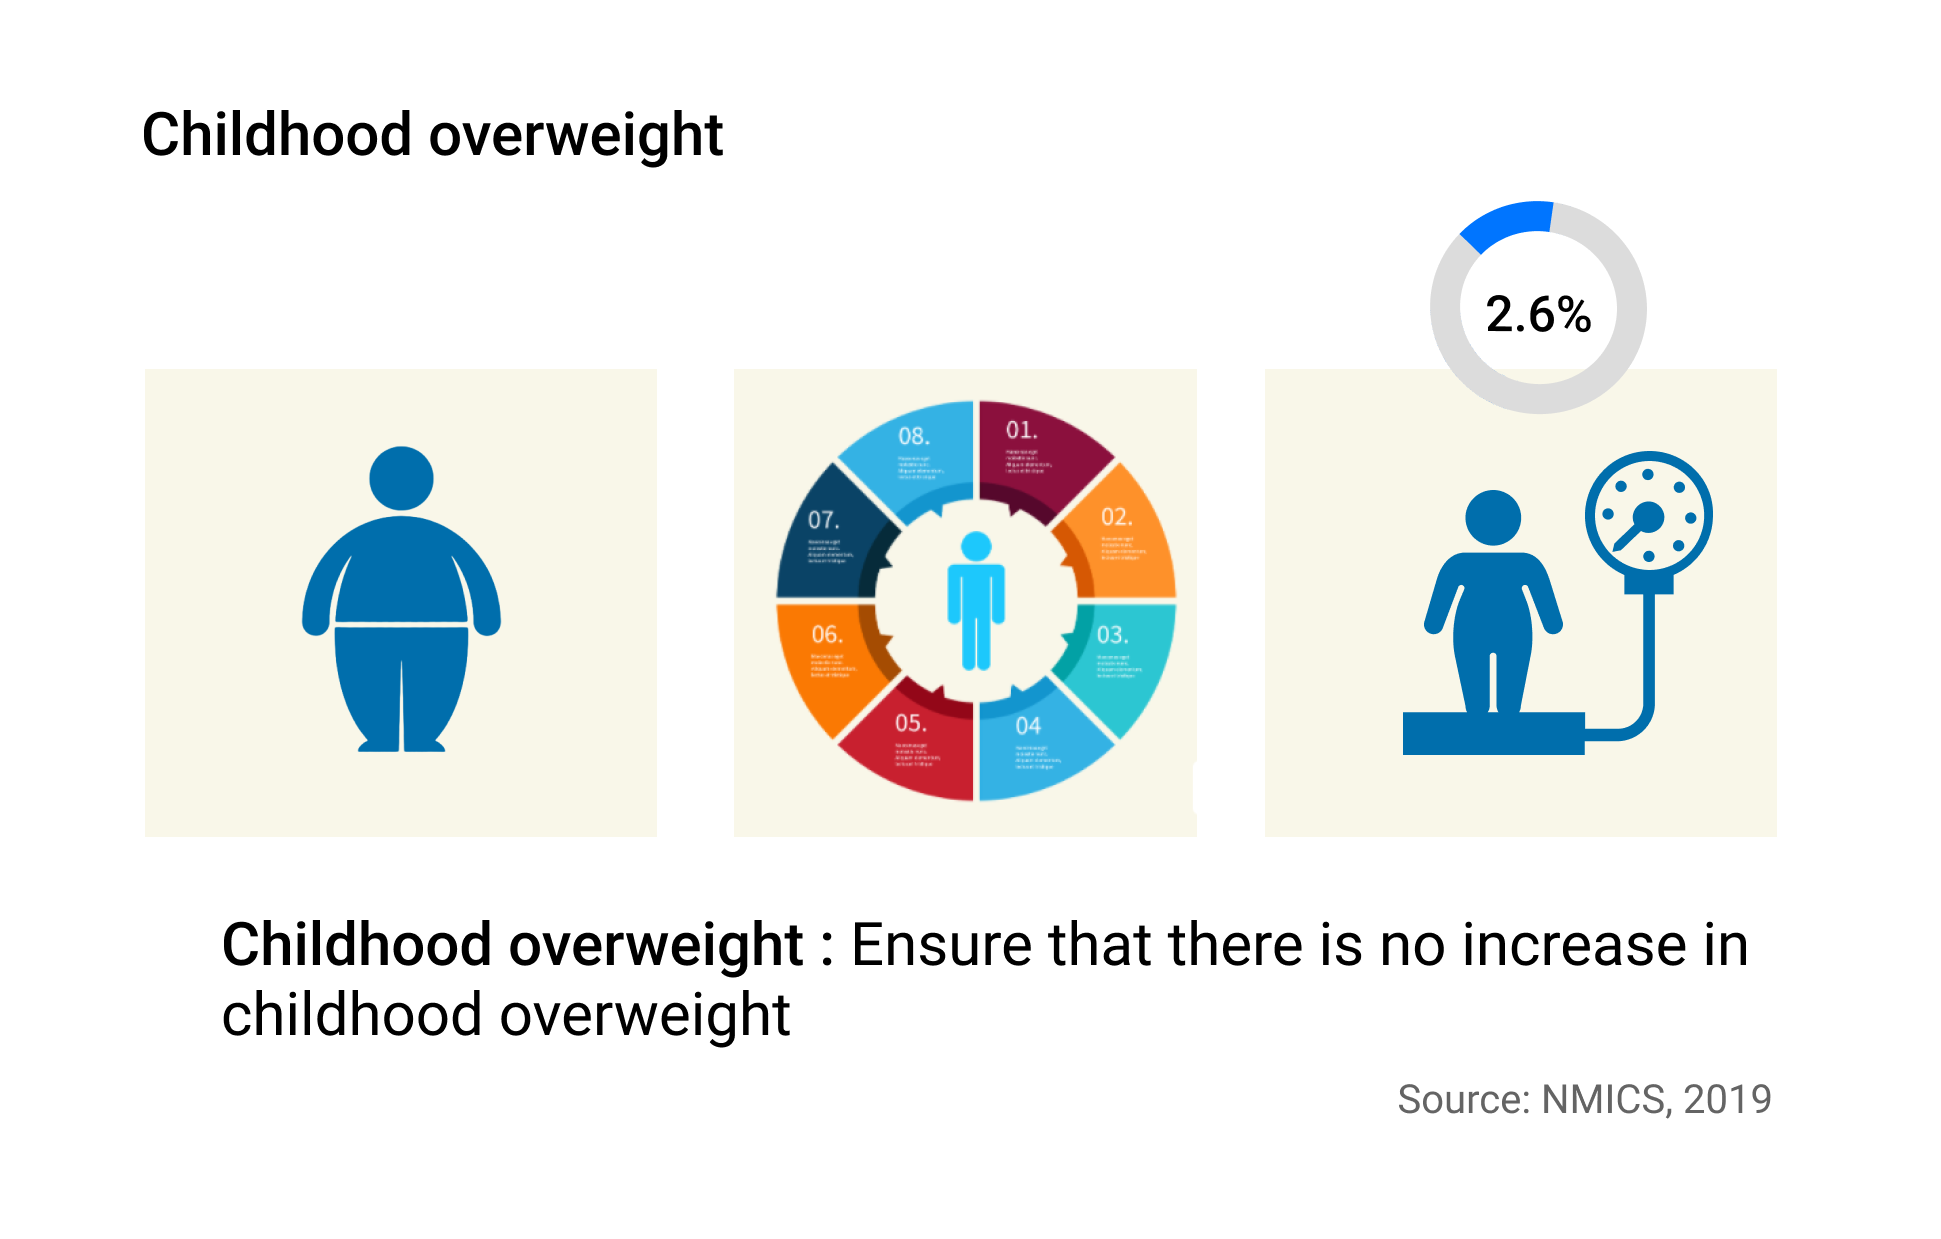
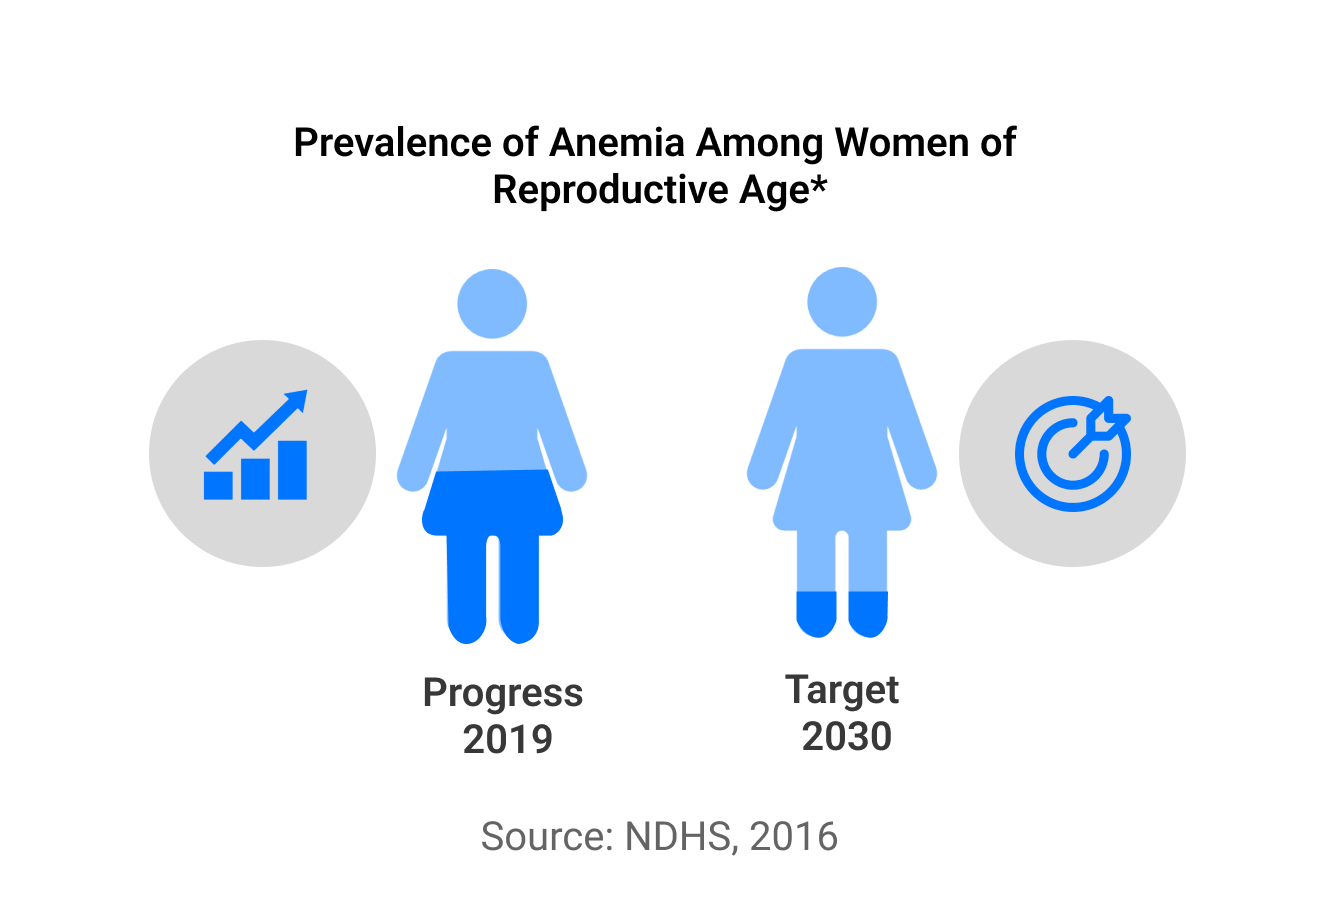
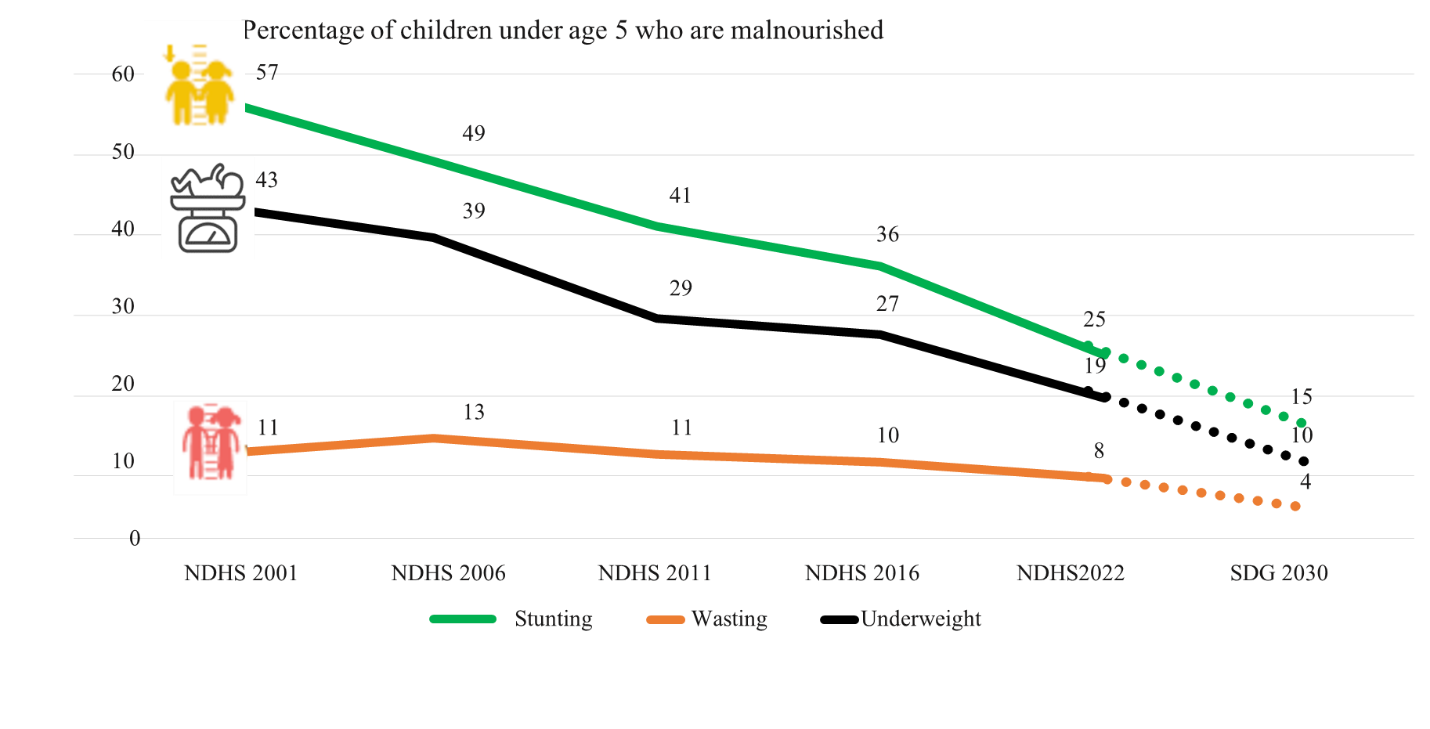
National surveys over the past decades have consistently demonstrated high levels of child undernutrition plaguing the country. Nepal Demographic Health Survey 2022 has reported that 2% of the Nepali children under five years were stunted (too short) and 8 percent were wasted (too thin) reflecting the extent of chronic and acute undernutrition respectively. According to Nepal Demographic Health Survey 2022, 43 percent of the children aged 6-59 months and 34 percent of the women aged 15-49 are anemic. With the implementation of MSNP, between baseline year 2011 and 2022, Nepal has made mixed progress on the achievement of the World Health Assembly’s (WHA) 2025 and SDG 2030 target (Table 1). There has been a large reduction in the prevalence of childhood stunting (short height for age) in Nepal in recent years; a reduction for under 5-year-old from 57 % in 2001 to 22 % in 2022 (Figure 2). There have been notable improvements in stunting (WHA target 1), childhood wasting (WHA 6) and childhood overweight (WHA 4). The overview of the nutrition status in Nepal against the global and national targets is illustrated below (Table 1).
Table 1. Overview of nutrition status against the global and national targets
| Indicators | MSNP–II Target 2022 | WHA Target 2025 | SDG Target 2030 | NDHS 2011 | NMICS 2014 | NDHS 2016 | NMICS 2019 | NDHS 2022 |
|---|---|---|---|---|---|---|---|---|
| Prevalence of stunting among children under 5 years | 28.0 | 24.2 | 15.0 | 40.5 | 37.4 | 35.8 | 31.5 | 24.8 |
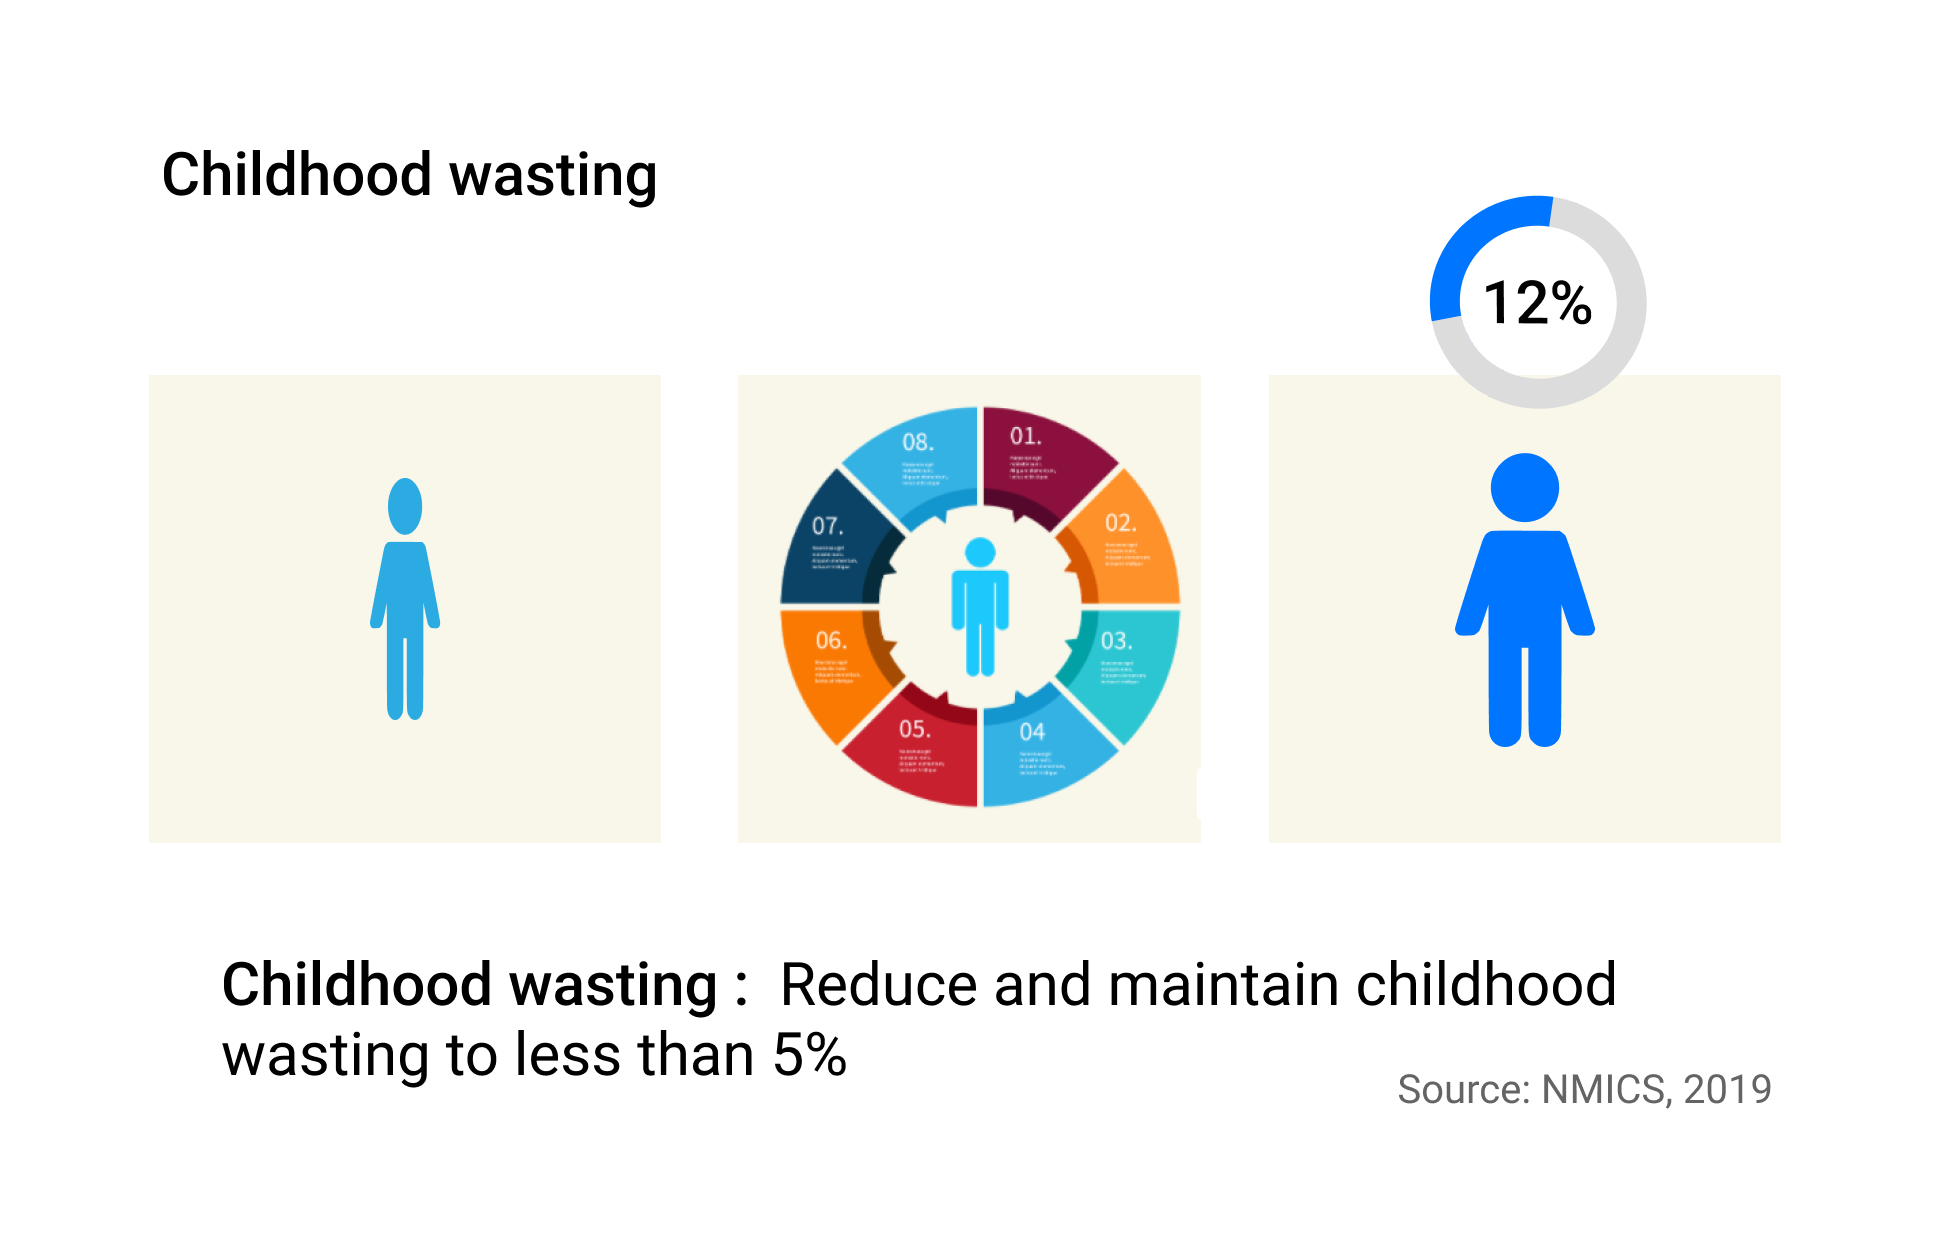
| Prevalence of wasting among children under 5 years | 7.0 | <5 | 4.0 | 10.9 | 11.3 | 9.7 | 12.0 | 7.7 |
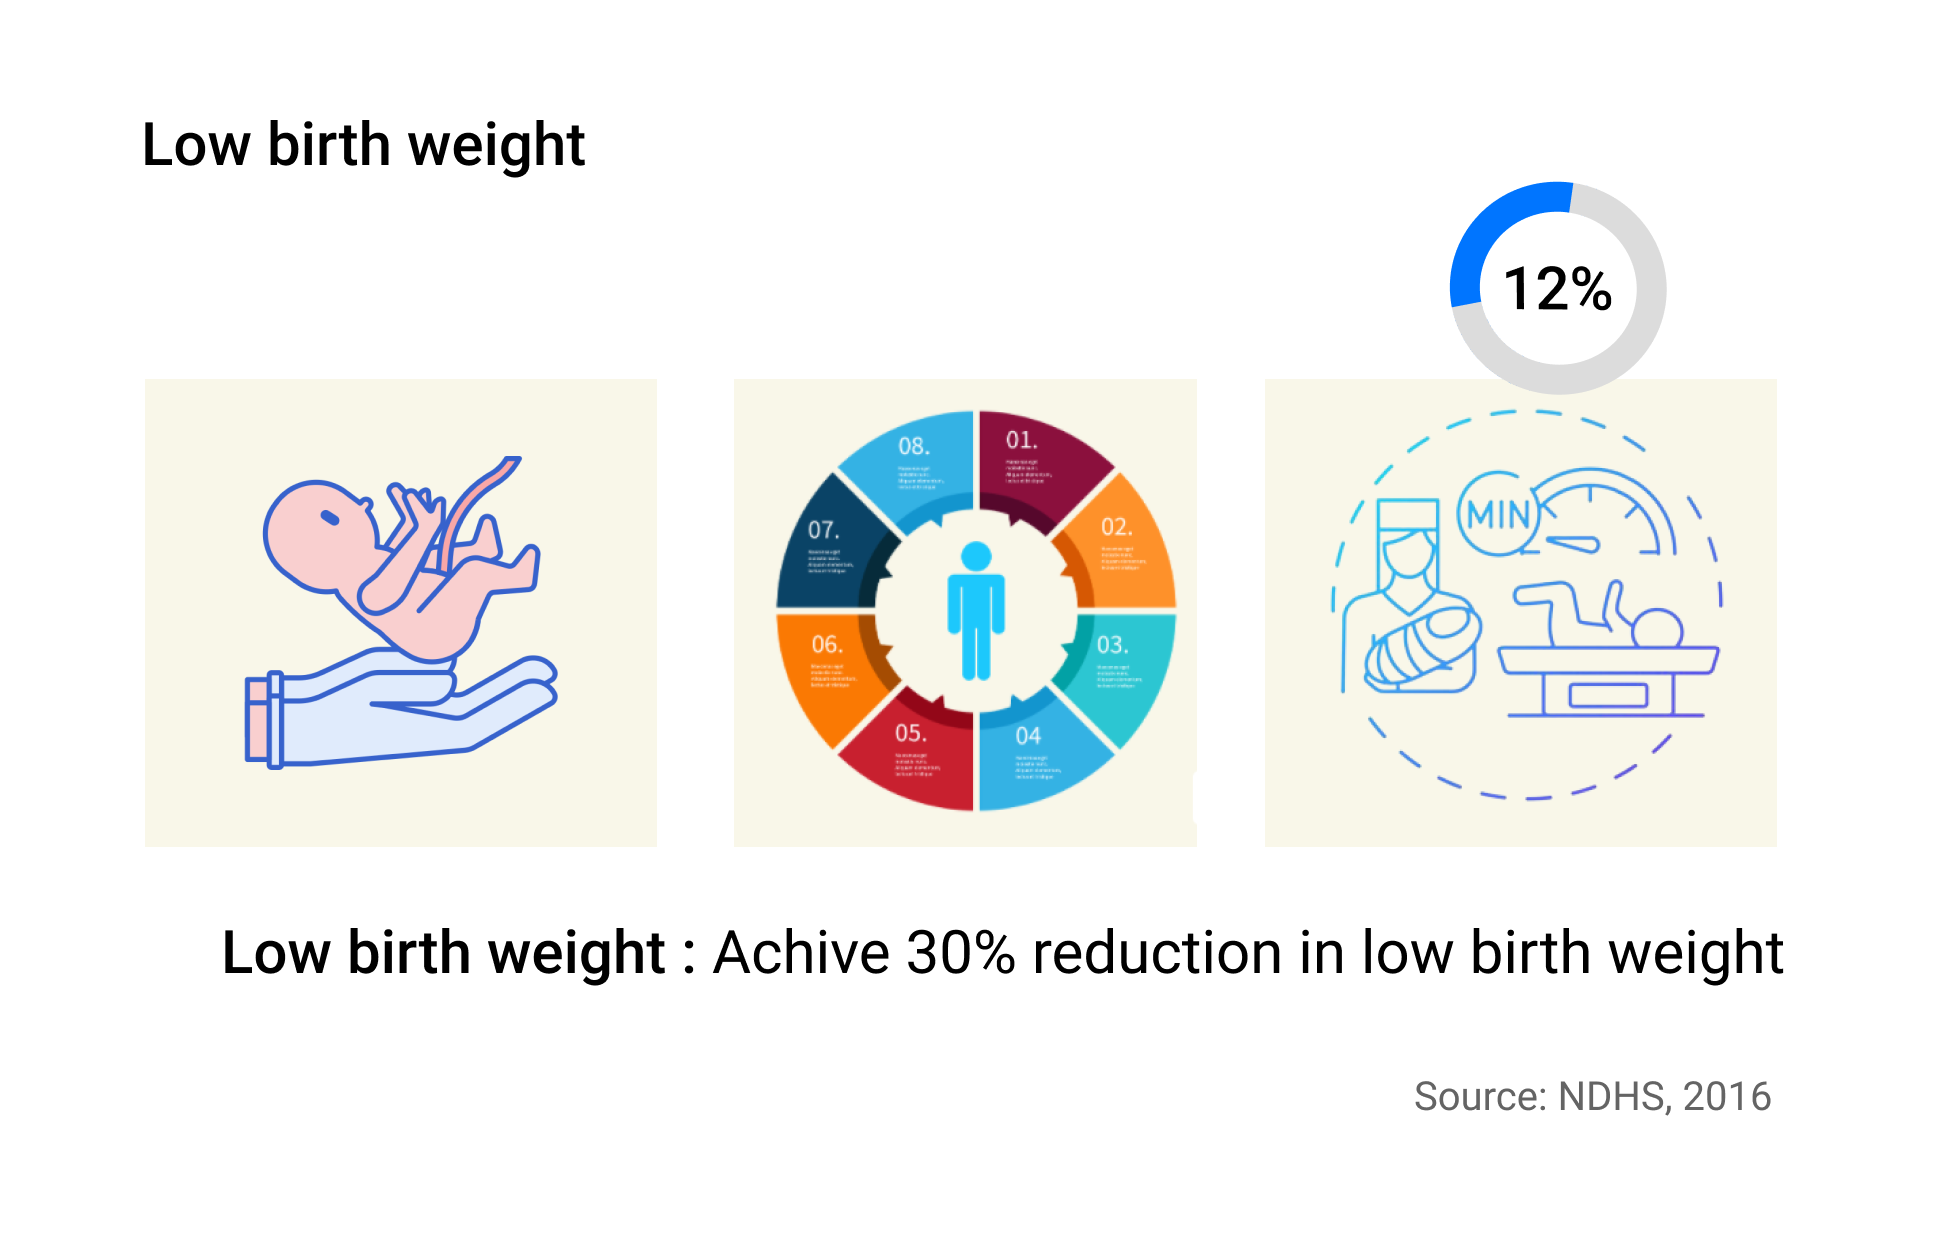
| Prevalence of low birth weight | 10.0 | 8.5 | <1.4 | 28.8 | 24.2 | 12.0 | NA | 11.5* |
| Prevalence of overweight/obese among children under 5 years | 1.4 | 1.0 | <1 | - | 2.1 | 2.1 | 2.6 | 1 |
| Prevalence of overweight/obese among Women of Reproductive Age (WRA) | 18.0 | 15.0 | <12 | 13.5 | - | 22.2 | - | NA |
| Anaemia among children aged 6-59 months | 28.0 | 20.0 | 10 | 46.2 | - | 52.7 | - | 43.4 |
| Anaemia among adolescent girls (10-19 years) | 25.0 | 25.0 | <25 | - | - | 39.0 | - | NA |
| Anaemia among WRA (15-49 years) | 24.0 | 18.0 | <10 | 35.0 | - | 40.8 | - | 34.0 |
Note: NMICS: Nepal Multiple Indicator Cluster Survey; HMIS: Health Management Information System; NDHS: Nepal Demographic and Health Survey; MSNP: Multi-Sector Nutrition Plan; WHA: World Health Assembly; SDG: Sustainable Development Goal; NA: Not Available
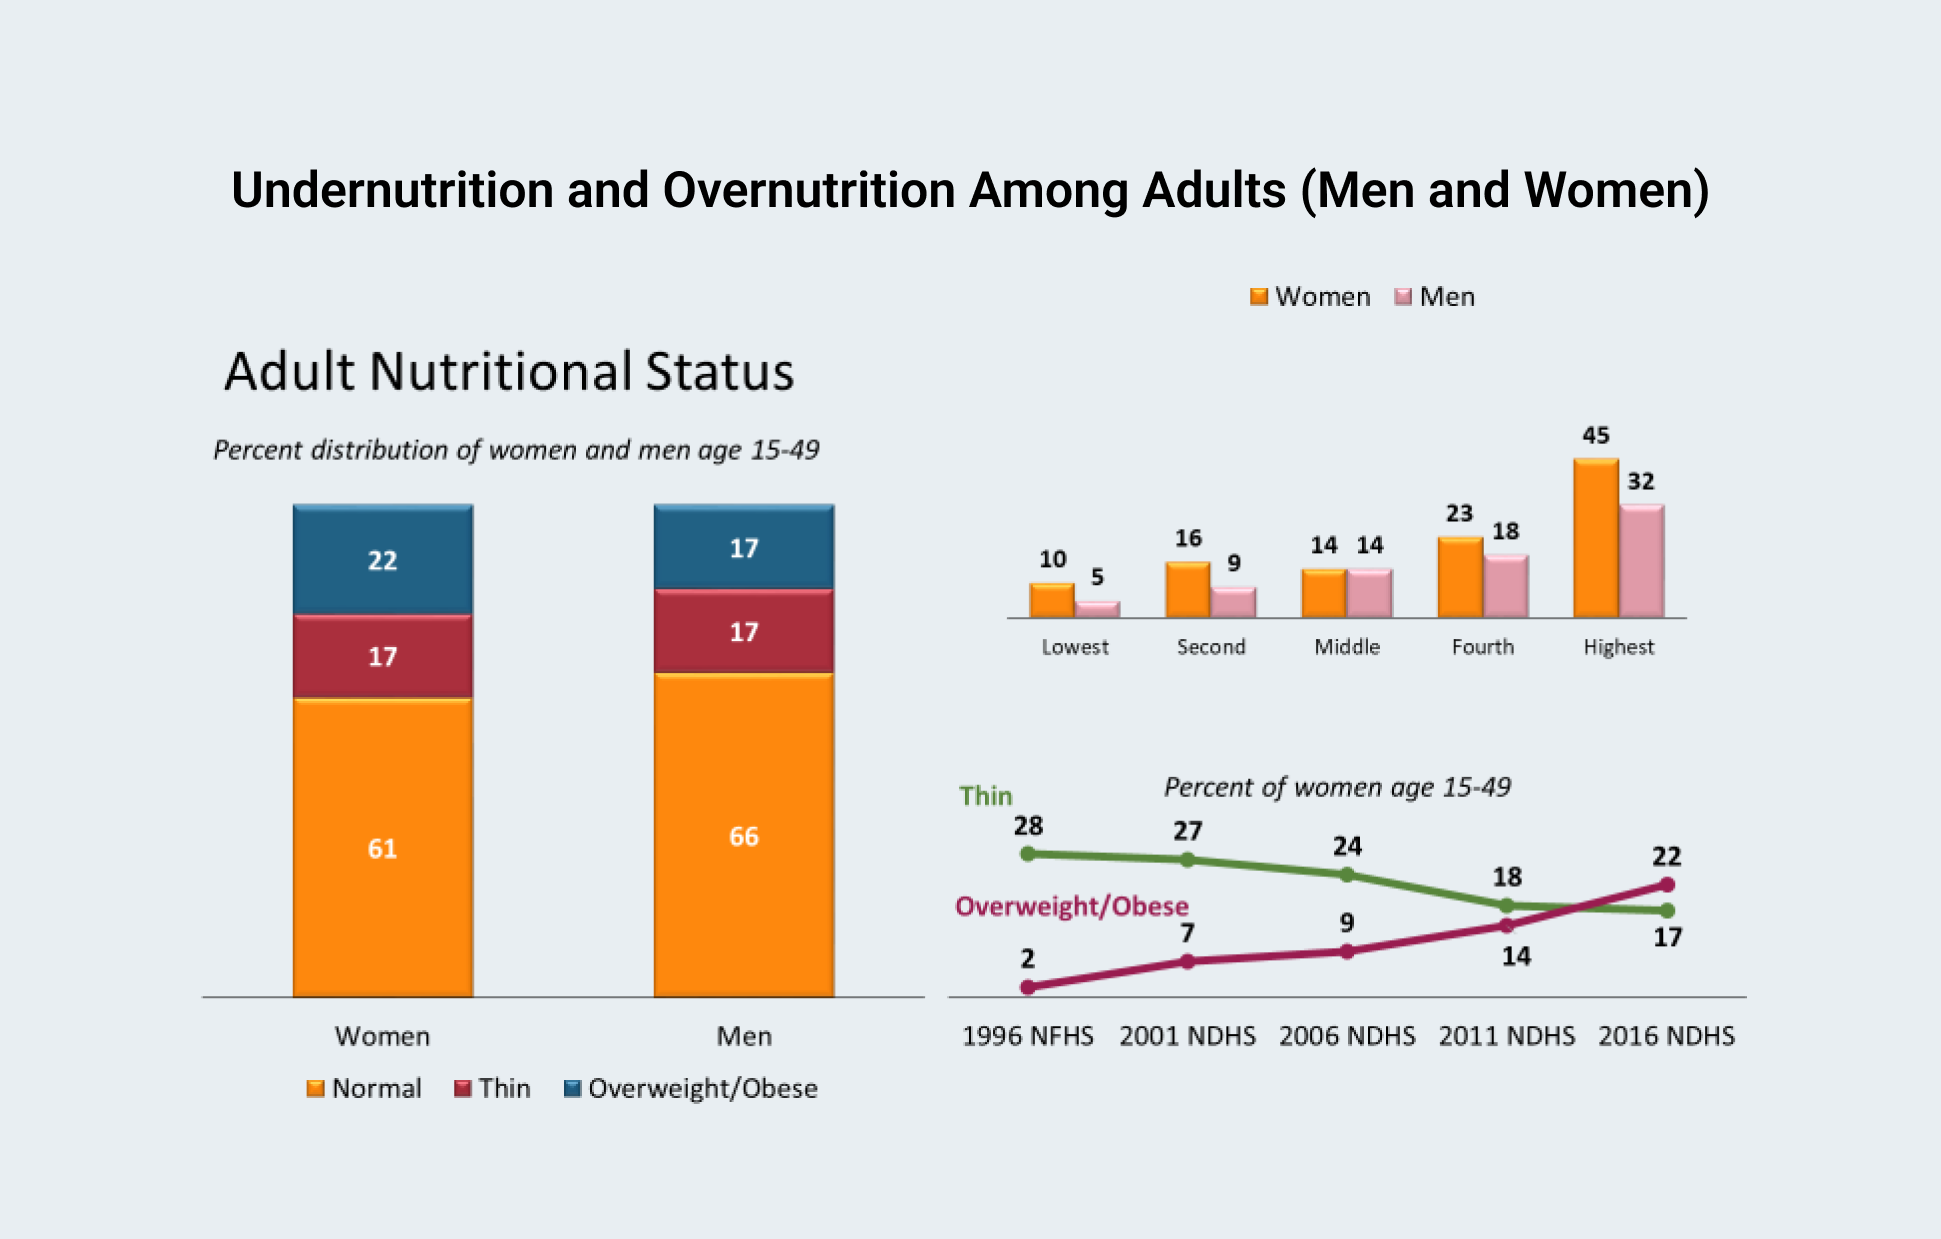
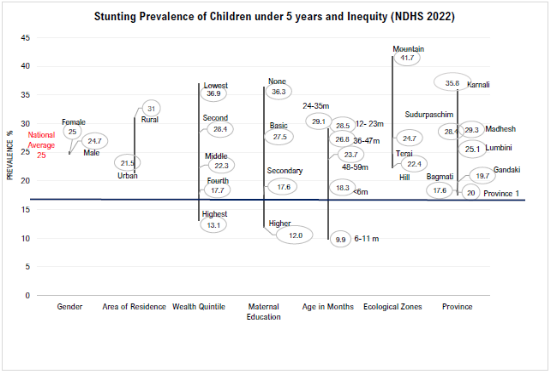
Despite the significant gains in nutrition in Nepal, deep disparities exist in nutrition indicators across provinces, ecological zone, regions, education, place of residence, and wealth quintiles (Figure 4). Besides, the problems of undernutrition and micronutrient deficiencies, the issues of over nutrition (obesity and overweight) are increasing among adults in Nepal as people’s diet has shifted toward processed foods with higher energy, fat, and sugar (Subedi, Marais, and Newslands 2017).
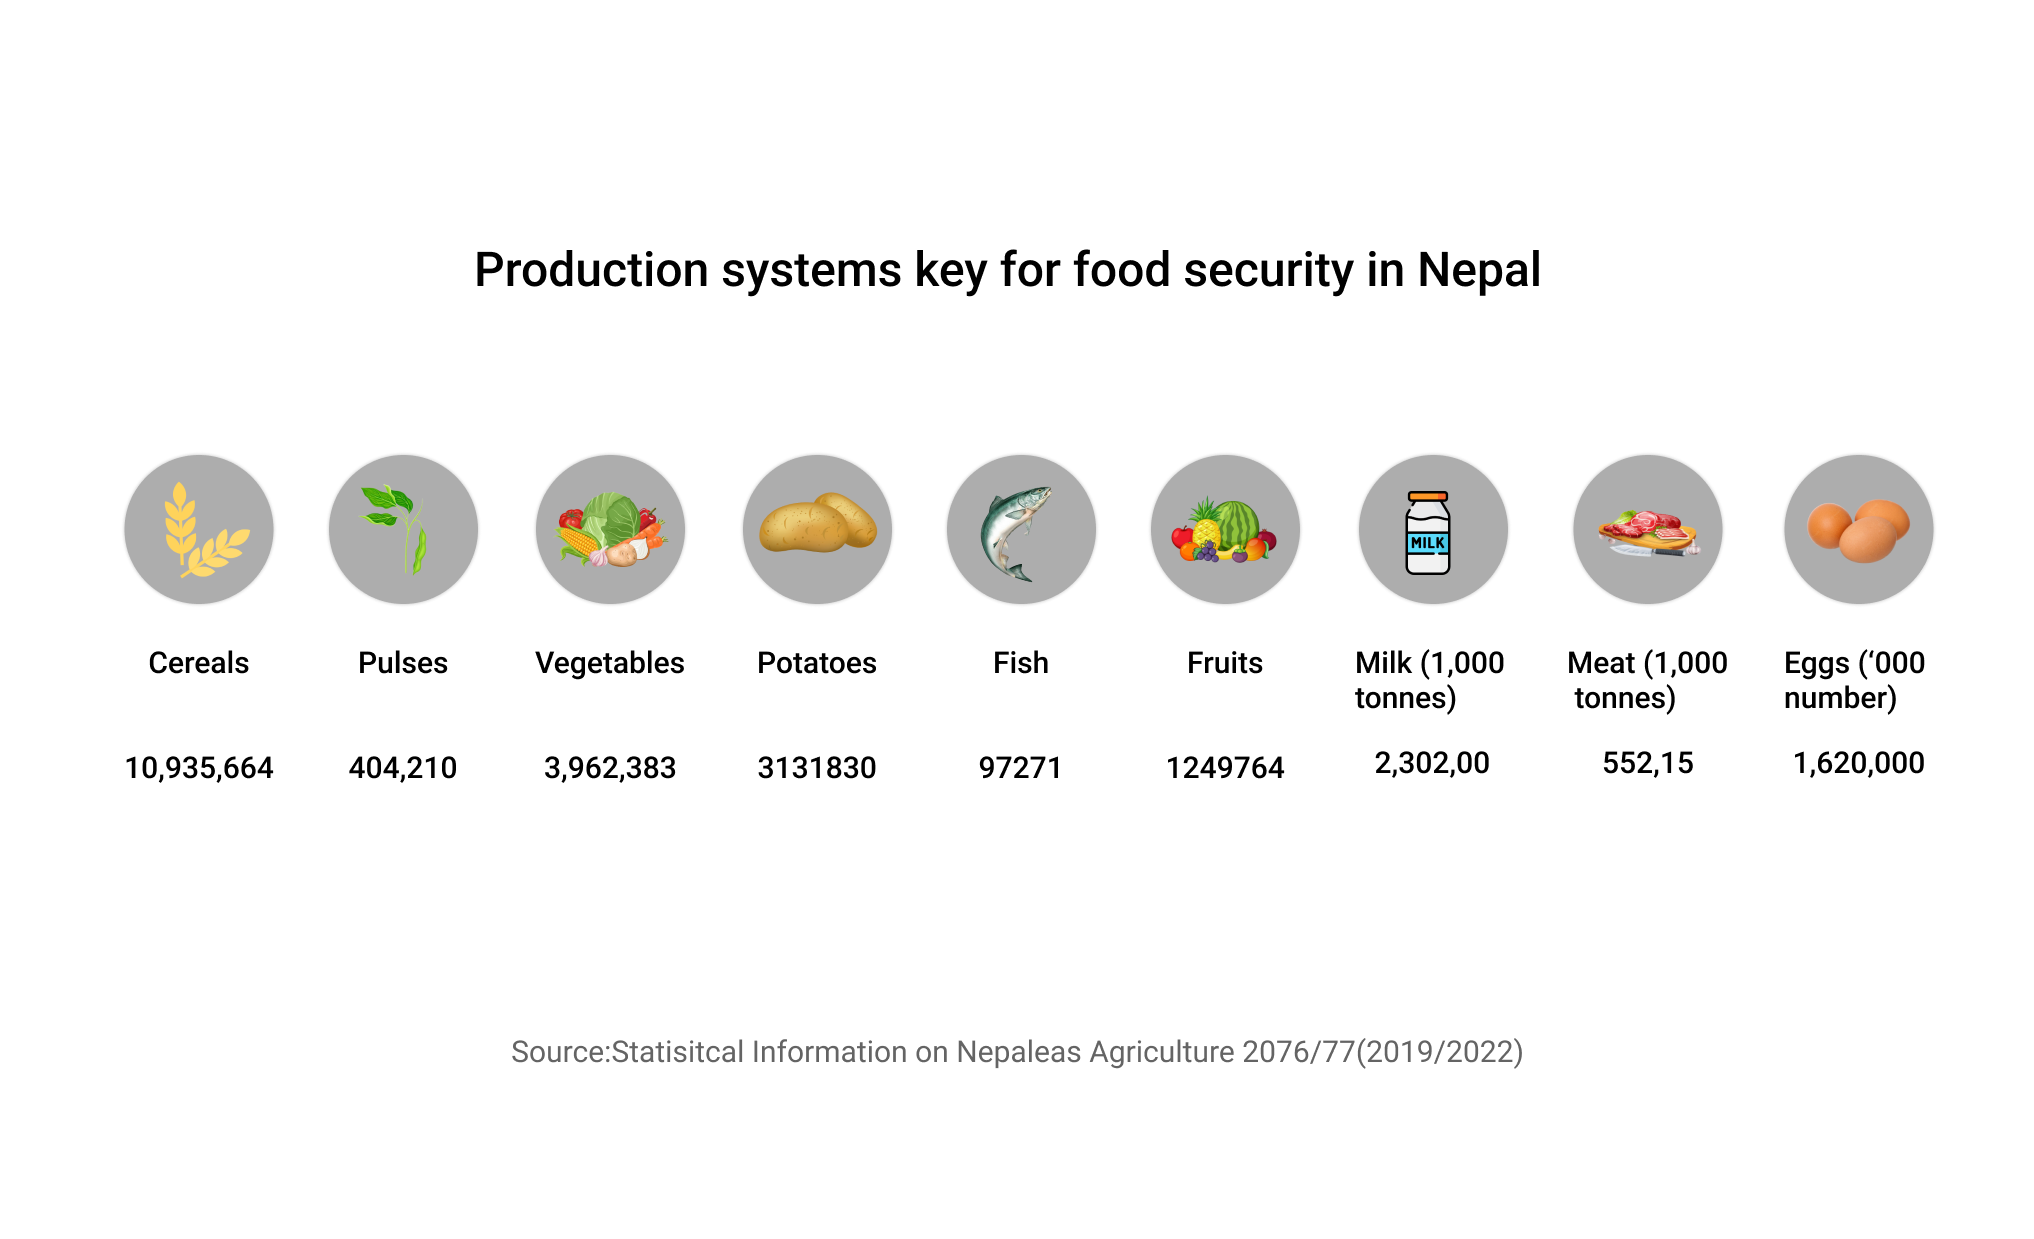
In sum, there has been improvement in poverty, food and nutrition situation over the years in Nepal. However, dedicated and rigorous efforts are required to address the multi-faceted and complex nature of malnutrition and food insecurity and reduce the existing disparities in nutrition outcome and other development indicators. Further, nutrition and food security are multidimensional. Thus, other multi-sector statistics such as education, agriculture, livestock, WASH, women, children and social protection, governance are intertwined to them. The multi-sector indicators work in a bidirectional pathway meaning they are contributors to poor nutrition and food insecurity and can also be their manifestations. Realizing the need to address the determinants of nutrition through multi-sectoral approach, the Government of Nepal (GoN) is committed to scaling up a set of evidence-based nutrition interventions through its Multi-sector Nutrition Plan (MSNP) to reduce malnutrition in all its forms.